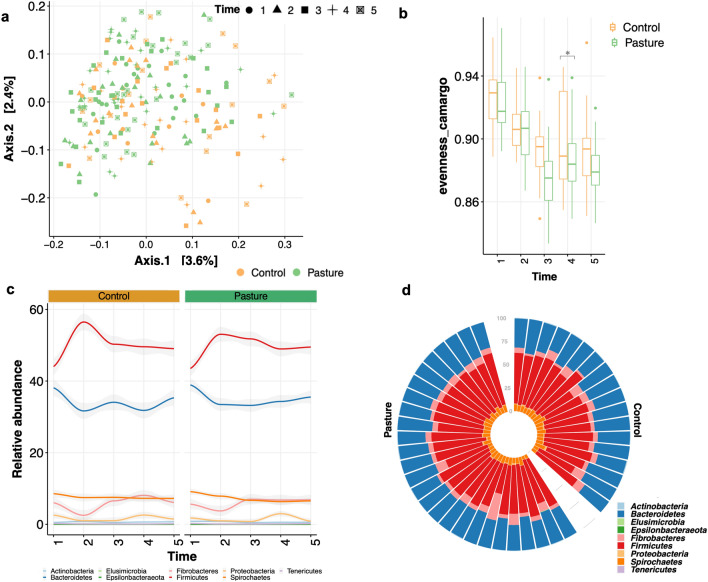
Figure 3.
Description of the bacterial community diversity and the main phyla between groups. (a) Dissimilarities in fecal microbiota composition represented by the non‐metric multidimensional scaling (NMDS) ordination plot, with Bray–Curtis dissimilarity index calculated on un-scaled ASVs abundances. Samples are colored by group: pasture (green) and control (orange). The shape of dots indicates the longitudinal time point (from 1 to 5); (b) box plot representation of the evenness Camargo index using the rarefied ASVs table for each group and time points. The box plot features the median (center line) and interquartile range, and whiskers indicate 5th to 95th percentile; (c) Longitudinal evolution of the most abundant phyla of horse gut microbiota in the control and pasture groups. Graph shows relative abundance (y axis) of the most common bacterial phyla over time (x axis), averaged across control and pasture groups; (d) circular stacked bar plot of the main phyla for each individual in the cohort. Rare phyla such as Elusimicrobia, Verrucomicrobia and Synergistetes are not represented (mean relative abundance across groups < 0.01%). Individuals are stratified by groups. All plots were produced in R software https://www.r-project.org, using the version 4.0.2.

