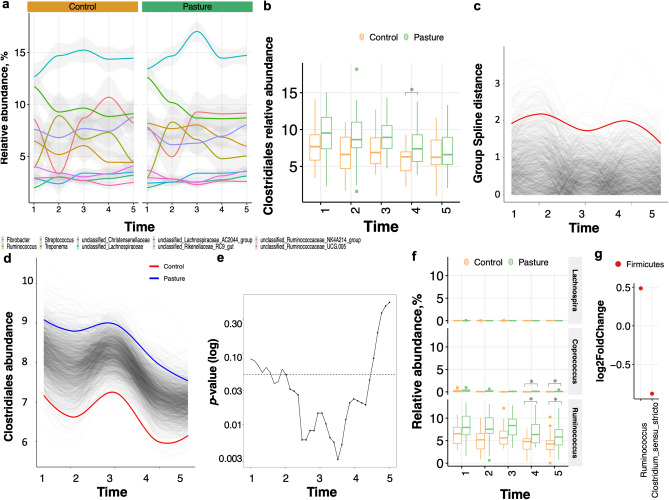
Figure 4.
Longitudinal fecal microbiota composition differences between groups. (a) The longitudinal variation of the 10 most abundant genera in the horse fecal microbiota between groups. Graph shows relative abundance (y axis) of the most common bacterial genera over time (x axis), averaged across control and pasture group; (b) box plot representation of the relative abundance of Clostridiales between groups and across time. The box plots feature the median (center line) and interquartile range, and whiskers indicate 5th to 95th percentile; (c) permuted spline tests for statistical significance using the entire 27-month time series. Group distance plot for the Clostridiales comparison. The graph shows that permuted splines support a trend toward a greater true statistical difference after T3. The observed difference between the groups exceeded the random permuted distribution, which supports the statistically significant finding (p < 0.05); (d) Clostridiales abundance was different between pasture group (group spline in blue) and control horses (group spline in red; 9,999 permutations, p < 0.05); (e) the plot output of the sliding spliner function shows a window of significance between the T3 and T4 time points. The p-value at each specified interval derived from the distribution of points from individuals’ smoothed splines. Dotted line indicates p = 0.05; (f) box plot representation of the relative abundance of the single taxa included within Clostridiales between groups and across time. The box plots feature the median (center line) and interquartile range, and whiskers indicate 5th to 95th percentile. Asterisk indicates p < 0.05; (g) dot plot representation of log-transformed fold change of genera that were significantly different between pasture and control across time using DESeq2. The log of fold changes superior to 0 indicate that genera were more abundant in pasture individuals than control individuals at any time of the experiment. By contrast, the log of fold changes inferior to 0 indicate that the genera abundances were lower in pasture relative to control individuals. Dots are colored by phyla. All plots were produced in R software https://www.r-project.org, using the version 4.0.2.

