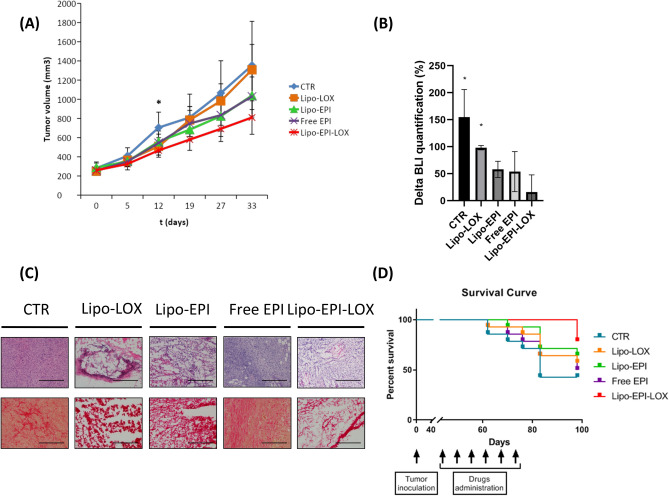
Figure 4.
(A) Tumor growth curves of orthotopic xenograft mouse model of human TNBC. Five group mice (n = 10 each group) treated with empty liposome (CTR), Lipo-LOX, LIPO-EPI, free EPI and Lipo-EPI-LOX. (B) Delta quantification of TNBC bioluminescent signal after 4 weeks of treatment. (C) Representative example of H&E stained sections of explanted tumors 55 days post treatment. Control: markedly atypical and pleomorphic cells (5% necrotic tumor cells). Scale bar is 400 µm. Lipo-LOX: fibrotic tissue with atypical cells and neoplastic crown (25% necrotic tumor cells). Lipo-EPI: Neoplastic cells and necrotic bands (50% necrotic tumor cells). Free EPI: tumor cells infiltrating adipose tissue with minimal necrotic features e limited inflammation (20% necrotic tumor cells). Lipo-EPI-LOX : tumor cells infiltrating adipose tissue with artifacts (60% necrotic tumor cells). Representative example of collagen stained sections of explanted tumors 55 days post treatment. Control: collagen fibers linearization ˃ 200 µm, Lipo-LOX collagen fibers linearization ˂ 200 µm, Lipo-EPI collagen fibers linearization ˃ 200 µm, free EPI collagen fibers linearization ˃ 200 µm, Lipo-EPI-LOX collagen fibers linearization ˂ 200 µm. Scale bar is 400 µm. (D) Kaplan–Meier curve indicating survival in tumor-bearing mice after tumor induction in the listed treatment groups (Control, Lipo-LOX, LIPO-EPI, free EPI and Lipo-EPI-LOX).

