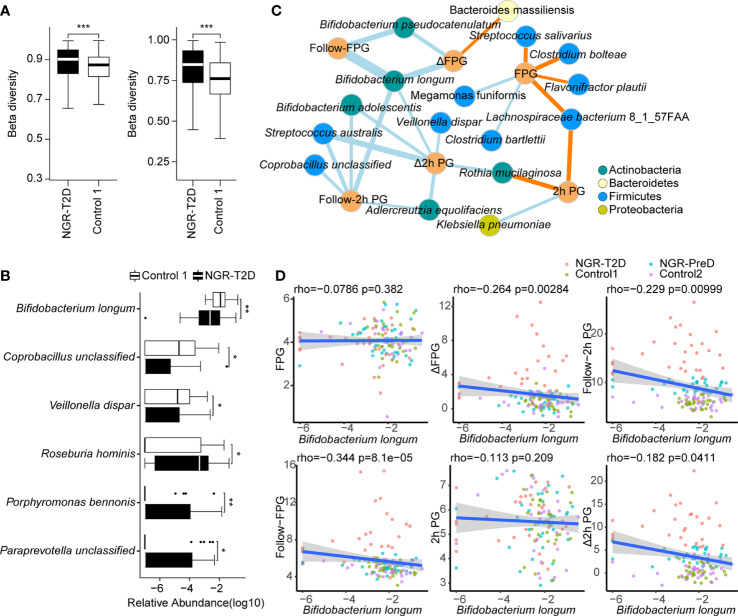
Figure 2.
Differences in the fecal microbial communities and the correlation between fecal microbiota and glucose levels. (A) The comparison of beta diversity at the gene (left) and species (right) level. (B) Species with significantly different abundance in NGR-T2D (n=30) compared with control 1 (n=30). Two-tailed Wilcoxon rank-sum test was used to determine statistical significance, *P < 0.05, **P < 0.01, ***P < 0.001. (C) The network of correlations between species and phenotypes from all the individuals (n=126) was established by Spearman’s correlation analysis. Blue edges, represent significantly negative correlations, P < 0.05; yellow edges, represent significantly positive correlations, P < 0.05. Sizes of the edges represent the |rho| of Spearman’s correlation coefficient. (D) Scatter plot of glucose levels versus the relative abundance of Bifidobacterium longum. The linear regression line and the 95% confidence interval are visualized. The correlations between the Bifidobacterium longum abundance and the glucose level were calculated by Spearman’s correlation analysis (n=126). NGR-T2D: participants had normal glucose regulation at stool collected, and they developed T2D in the follow-up. FPG, baseline fasting plasma glucose; 2h PG, baseline plasma glucose 2h after oral glucose tolerance test; follow-FPG, follow-up fasting plasma glucose; follow-2h PG, follow-up 2h postprandial plasma glucose; Δ FPG, the difference between Follow-FPG and FPG; Δ 2h PG, the difference between follow-2h PG and 2h PG.

