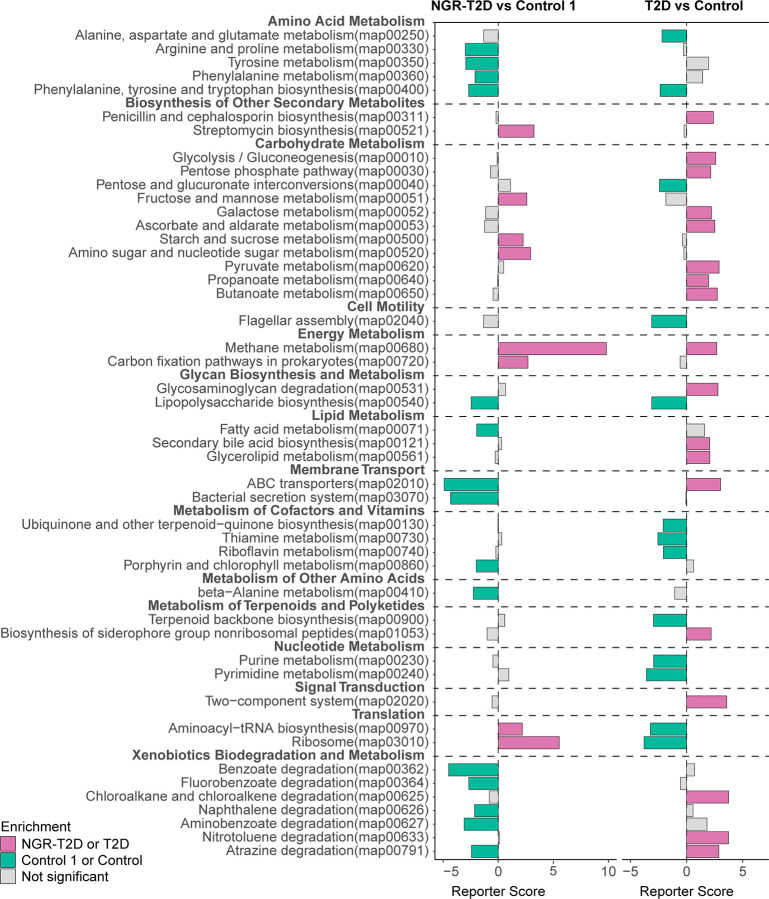
Figure 3.
Differential enrichment of functional pathways. Left: differential enrichment between NGR-T2D (n = 30) and control 1 (n = 30) group. Right: differential enrichment between Chinese T2D patients (n = 60) and healthy controls (n = 60). X-axis represents reporter score. NGR-T2D: participants had normal glucose regulation at stool collected, and they developed T2D in the follow-up.

