FIGURE 3.
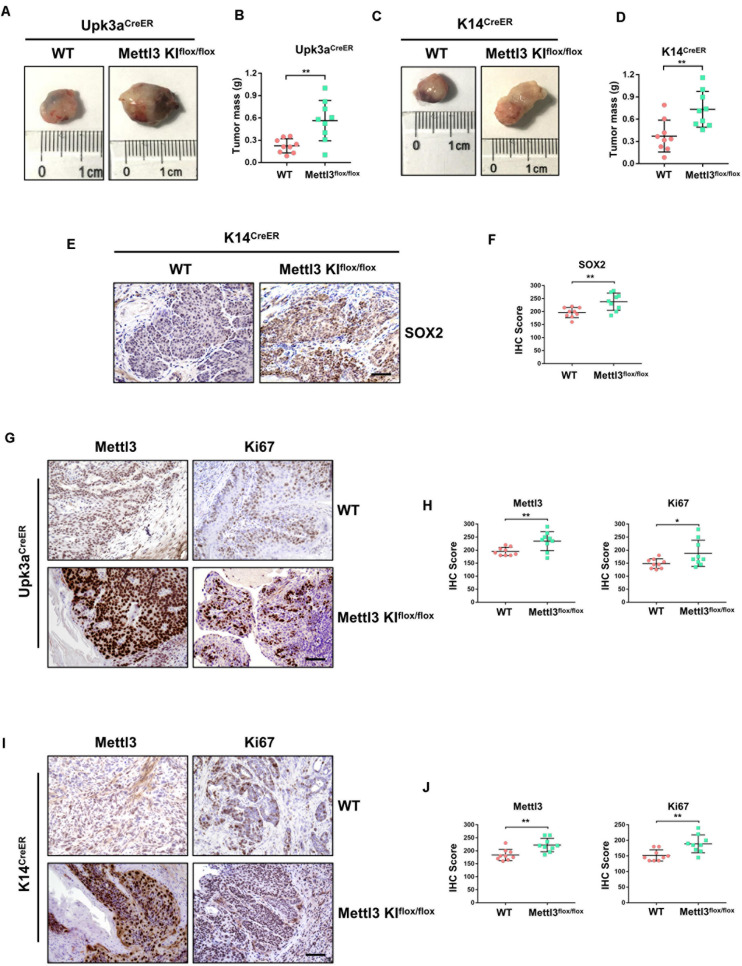
Overexpression of Mettl3 in urothelium or K14+ cells promotes bladder cancer (BCa) progression in vivo. (A) Representative images of BCa in Upk3aCreER WT (left) and Upk3aCreER Mettl3 KI (right) mice showing the tumor volume. (B) Measurement of tumor mass in Upk3a-specific WT and Mettl3 KI groups, respectively. (C) Tumor volume was shown in K14-specific WT (left) and KI (right) mice. (D) The weight of tumor collected from K14CreER wild-type and K14CreER Mettl3 KI mice was calculated, respectively. (E) immunohistochemistry (IHC) staining showing SOX2 expression in WT and Mettl3 KIflox/flox mice. Scale bars, 100 μm. (F) The IHC score was computed according to the intensity and frequency of SOX2 expression. (G) Immunostaining was applied to explore the expression level of Mettl3 and Ki67 in Upk3aCreER WT or Mettl3 KI mice. Scale bars 100 μm. (H) IHC scoring was calculated based on the statistics of staining intensity and ratio of positive cells above. (I) Representative IHC staining images of Mettl3 or Ki67 in K14CreER wild-type and K14CreER Mettl3 KI mice. Scale bars, 100 μm. (J) Calculation of IHC scores according to the immunostaining images above. *p < 0.05; **p < 0.01.

