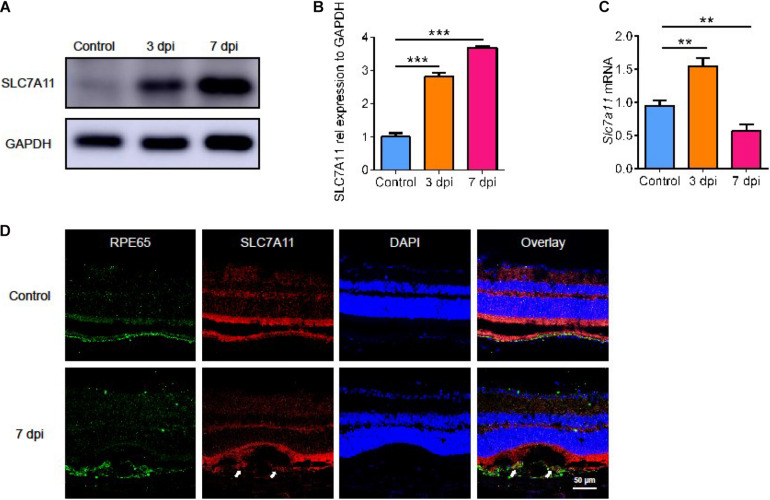
FIGURE 2.
The expression of SLC7A11 in the natural course of laser-induced CNV in mice. (A,B) The level of SLC7A11 protein at various points in time after laser by Western blot (n = 3). (C) The level of Slc7a11 mRNA after laser by RT-PCR (n = 6). (D) The location of SLC7A11 (white arrow) by immunofluorescence. Bar graphs show mean ± SD. P-values: one-way ANOVA analysis (***p < 0.001, **p < 0.01). Scale bar = 50 μm.

