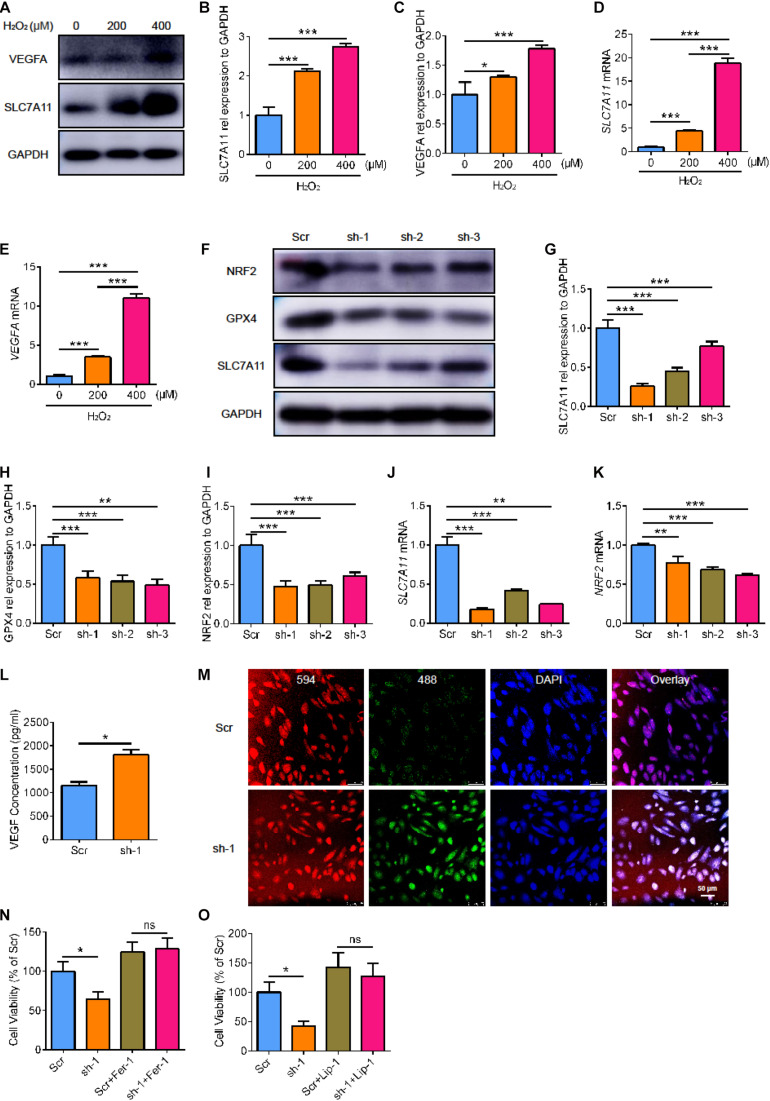
FIGURE 4.
The cell viability and lipid peroxidation level of SLC7A11KD ARPE19. (A–C) The protein expression of SLC7A11 and VEGFA in ARPE19 with different concentration of H2O2, including 0, 200, 400 μM (n = 3). (D,E) The mRNA level of SLC7A11 and VEGFA in ARPE19 with different concentration of H2O2 (n = 6). (F–I) The expression of SLC7A11, GPX4, and NRF2 protein using shRNA to knock down SLC7A11 (n = 3). (J,K) The mRNA of SLC7A11 and NRF2 using shRNA to knock down SLC7A11 (n = 6). (L) The concentration of VEGF of SLC7A11KD ARPE19 by ELISA (n = 5). (M) The level of lipid peroxidation of SLC7A11KD ARPE19 by BODIPYTM 581/591 (n = 5). (N,O) The cell viability of SLC7A11KD ARPE19 with the treatment of Fer-1 (1000 nM) and Lip-1 (20 μM) (n = 6). Bar graphs show mean ± SD. P-values: T-test and one-way ANOVA analysis. (***p < 0.001, **p < 0.01, *p < 0.05). Scale bar = 50 μm.

