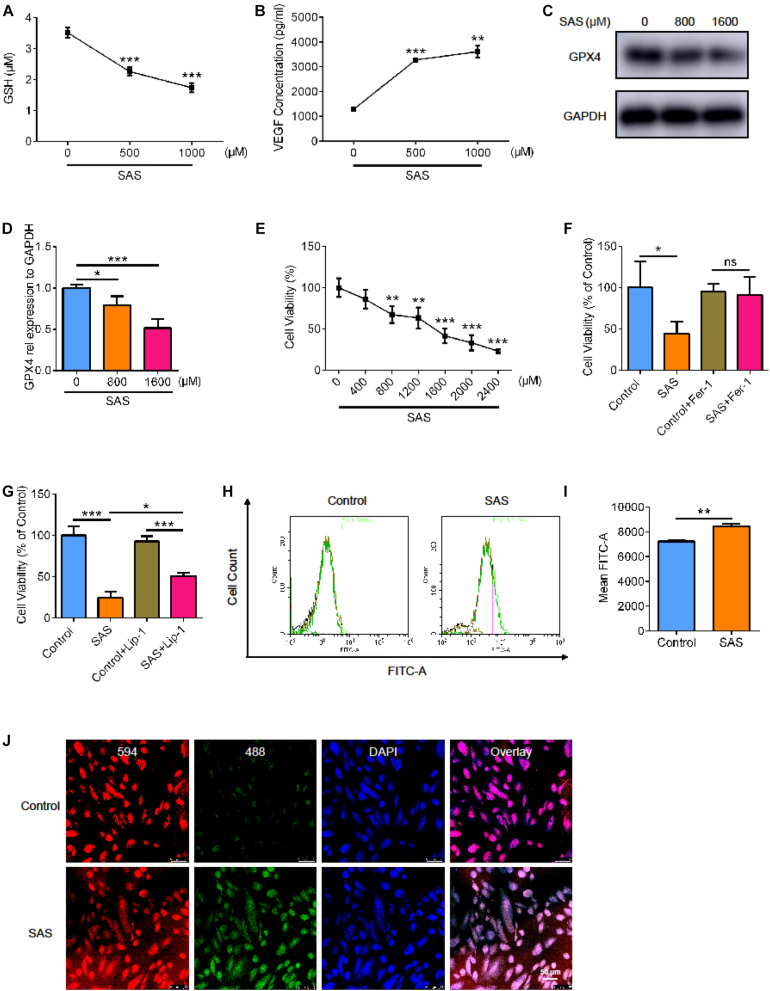
FIGURE 5.
The effect of SLC7A11 inhibitor on ARPE cell line. (A) The GSH of ARPE19 with different concentration of SAS (n = 5). (B) The concentration of VEGF of ARPE19 with SAS stimulation by ELISA (n = 5). (C,D) The protein expression of GPX4 with different concentration of SAS (n = 3). (E) The cell viability of ARPE19 with different concentration of SAS (n = 5). (F,G) The cell viability of ARPE19 with treatment of Fer-1 (1000 nM) or Lip-1 (20 μM) after stimulation of 1600 μM SAS (n = 6). (H–J) The level of lipid peroxidation under SAS stimulation by BODIPYTM 581/591 (n = 5). Bar graphs show mean ± SD. P-values: one-way ANOVA analysis and t-test (***p < 0.001, **p < 0.01, *p < 0.05). Scale bar = 50 μm.

