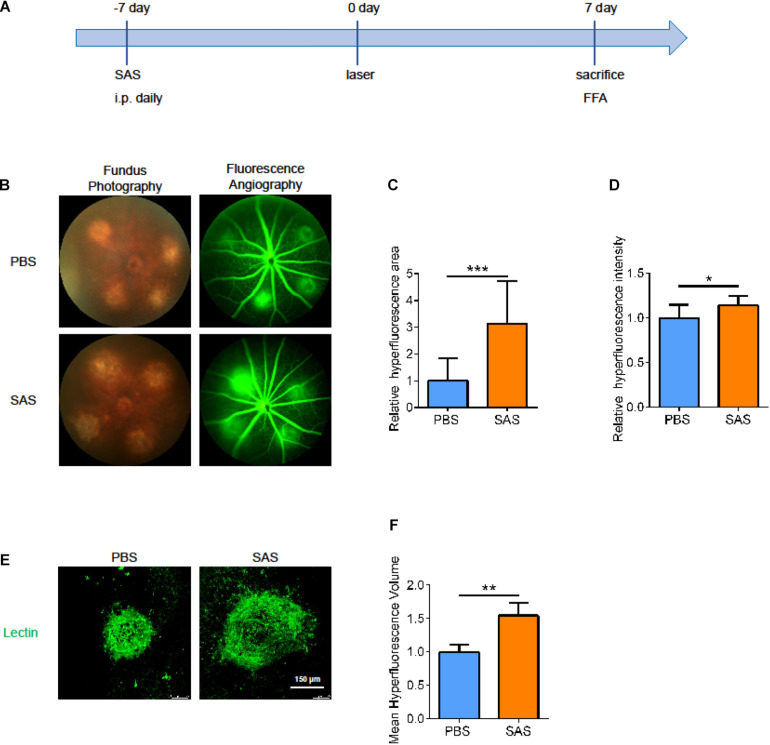
FIGURE 7.
The effect of SLC7A11 inhibitors on CNV areas. (A) Schematic diagram of mice administrated SAS. (B) Fluorescence imaging of mice after SAS treatment. (C,D) The average fluorescence intensity and leakage volume of fluorescence imaging after SAS treatment by Image-J (n = 6). (E,F) Laser spot size after SAS treatment by immunofluorescence and Image-J (n = 6). Bar graphs show mean ± SD. P-values: t-test (***p < 0.001, **p < 0.01, *p < 0.05). Scale bar = 150 μm.

