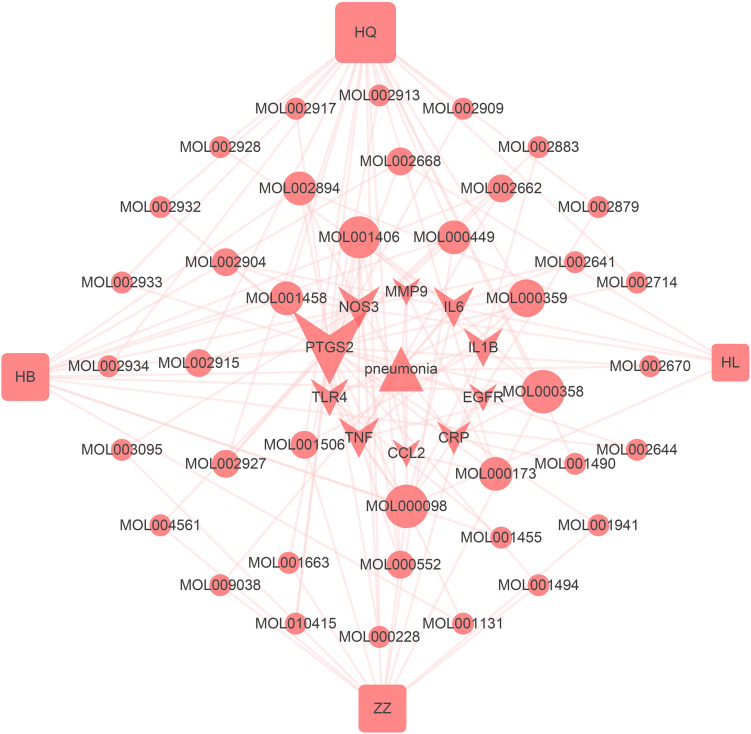
FIGURE 7.
Disease hub gene–active ingredient–herb network. Triangle nodes represent disease, arrow-like nodes represent hub genes, circle nodes represent the active ingredients related to the hub genes, and the square nodes represent herbs. The size of each node was set according to their degree value.

