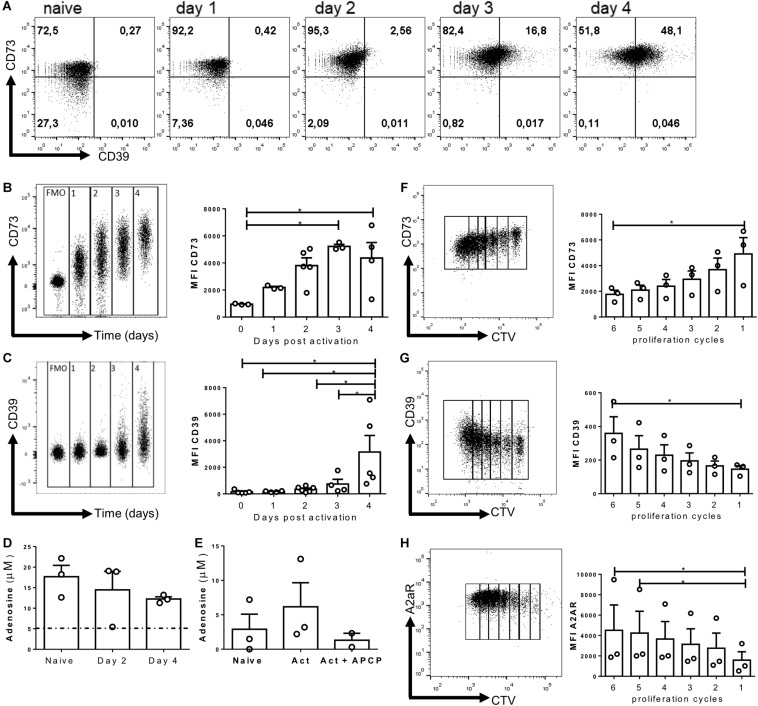
FIGURE 1.
Purinergic components are upregulated during in vitro activation. Naive CD8+ T cells from WT mice were isolated and activated with soluble α-CD3/CD28 antibodies for 4 days in vitro in the presence of IL-2 (10 ng/ml) for the generation of Tc1 lymphocytes. (A) Representative dot plots of CD39 and CD73 expression by in vitro-generated Tc1 cells at different time points. (B,C) Representative graph showing the concatenation and MFI of CD73 (B) and CD39 (C) on T cells at different days following activation. (D) Adenosine concentration obtained from naïve cells and in vitro Tc1 cultures at days 2 and 4 following activation. (E) Adenosine production by Tc1 cells cultured for 1 h in the presence of AMP (10 μM) and APCP (50 μM). (F–H) Representative dot plots and MFI graphs showing CD73 (F), CD39 (G), and A2AR (H) expression as a function of Tc1 proliferation cycles (at day 3) as assessed by cell trace violet dilution by FACS. Kruskal–Wallis Test, *p < 0.05, n = 3, Data is presented as the mean ± SEM.

