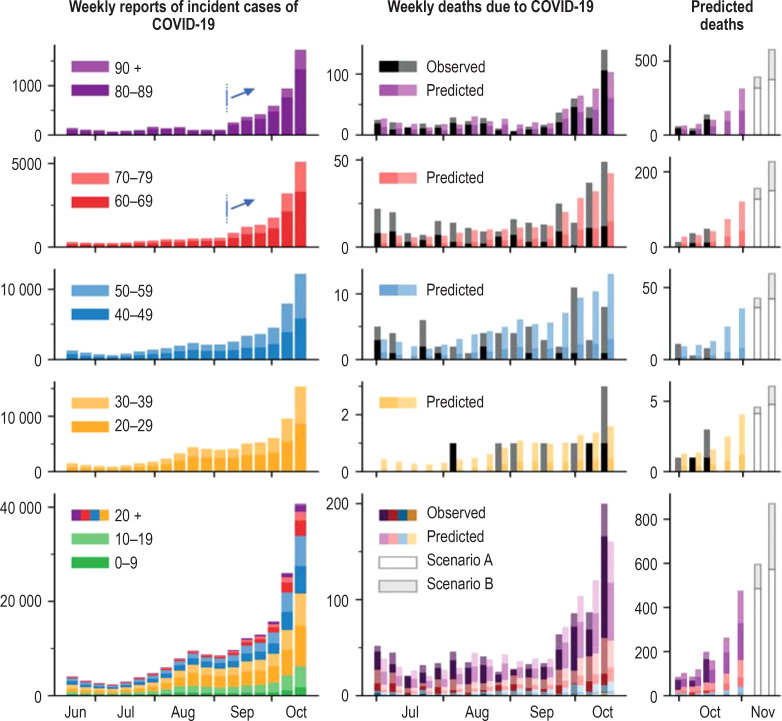
Figure.
The number of weekly COVID-19 cases (left), and the number of predicted and actual COVID-19-associated deaths are displayed for each age group (middle). The observed number of deaths (black) in each age group corresponds quite well to the predicted deaths calculated from the case numbers (color) using an age-dependent infection-fatality rate from a meta-analysis (4). Despite a rise in total reported cases since mid July (bottom), cases in the older age groups only started to rise in September (blue arrows). As a consequence, a rise in deaths is expected to unfold soon (right). The forecast scenarios A and B (gray, right column) predict a further increase in case numbers and deaths.

