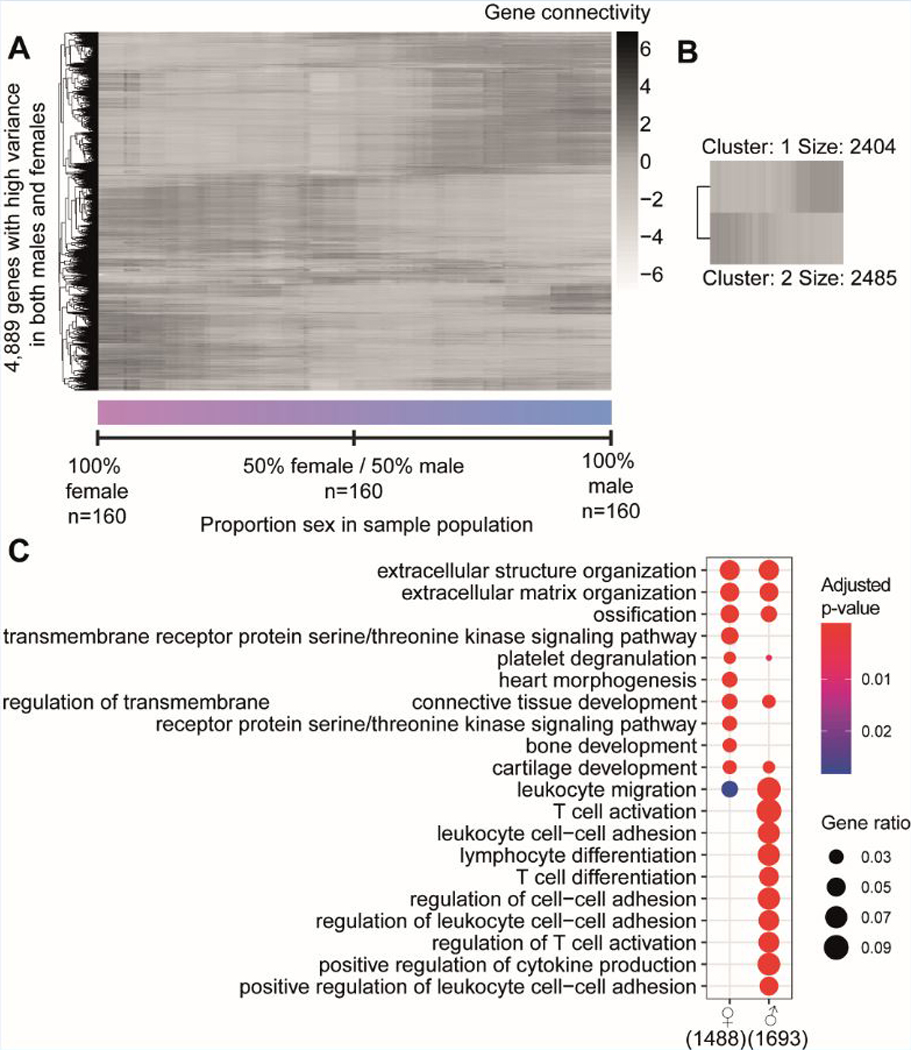
Figure 2. Sex as a biological variable in network biology.

A) A median-centered heatmap of log2 - connectivity values of 4,889 genes is shown over 160 populations that differ in proportion of sex. The left-most values indicate a population that is 100% female, while the right-most values indicate 100% male. Every step in between from left to right changes the ratio by removing one female sample and adding one male sample. B) A heatmap of k-means clustering of the genes from the connectivity pattern of figure 2A (kmeans k = 2). Two clusters are formed with cluster 1 containing 2,404 genes higher connected in predominantly male populations, while cluster 2 contains 2,485 genes higher connected in female populations. C) Gene enrichment analysis of k-means clusters 1 and 2. Color indicates significance, while size of the dot shows gene ratio. Number indicates the amount of genes from the original cluster that had a use in the analysis.
