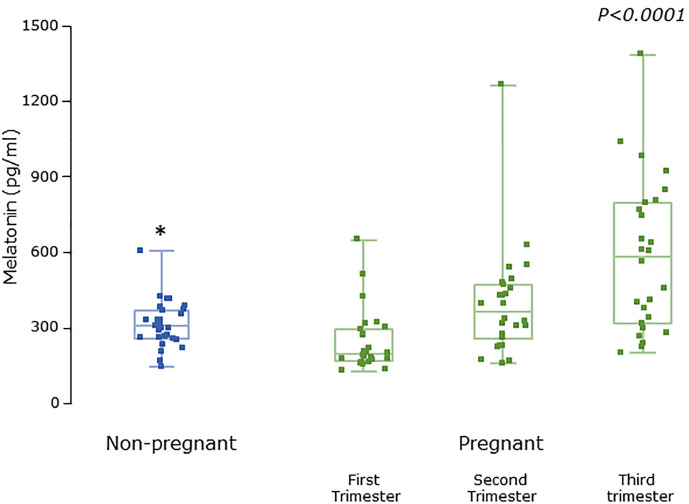
Figure 3.
Serum melatonin levels from MEL-P in non-pregnant healthy control subjects (n = 30) compared to pregnant subjects throughout pregnancy (n = 26), *, significantly different from pregnant women in the first (P = 0.0025), second (P = 0.04), and third (P=0.0005) trimesters, Wilcoxon-Mann Whitney test. P value shown is Friedman test over the trimesters showing increasing melatonin levels (P < 0.0001). Data are shown as median, interquartile, and full range with individual raw data points overlaid.

