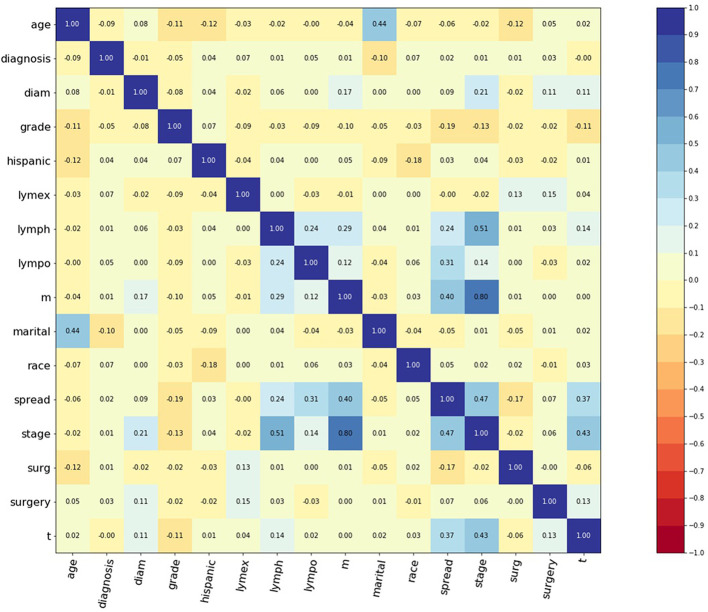
Figure 1.
Correlation matrix of 15 selected features. Values in this figure indicated the correlation coefficient of two corresponding variables. Color indicated strength of correlation, in which dark blue indicated strong positive, and dark red indicated strong negative relationships. Diagnosis: year when patients were diagnosed. Diam: diameter of tumor. Lymex: number of excised lymph nodes. Lympo: number of positive lymph nodes. Lymph: positive lymph nodes or not. Spread: extension of tumor. Surg: surgery or not. Surgery: surgery type.

