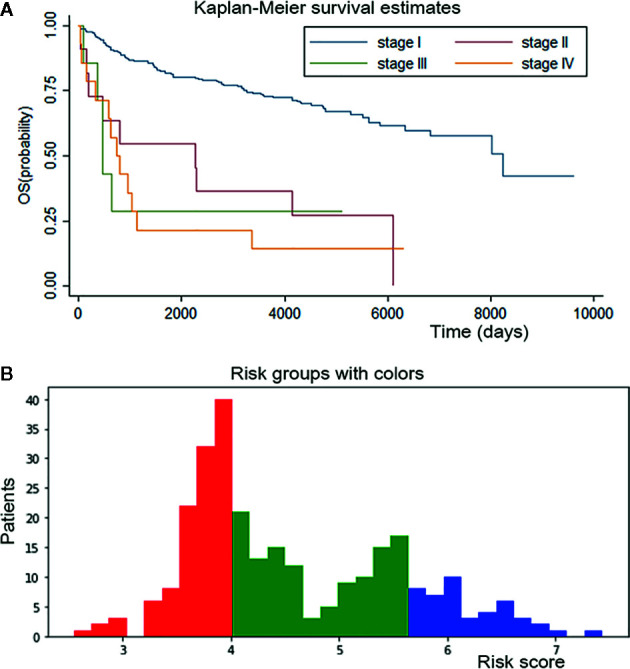
Figure 5.

Survival curves for conventional staging system and personalized survival prediction established by DSL model. (A) K-M curve of conventional staging system showed significant difference between stage I from other three stages and inapparent difference between stage II, III and IV. (B) We divided adenosarcoma patients into three stages according to risk factors calculated by our DSL model. Patients with a score of 0-4 were classified in stage I and marked in red color, patients with a score of 4-5.5 in stage II and green color, patients with 5.5-8 score in stage III and blue color.
