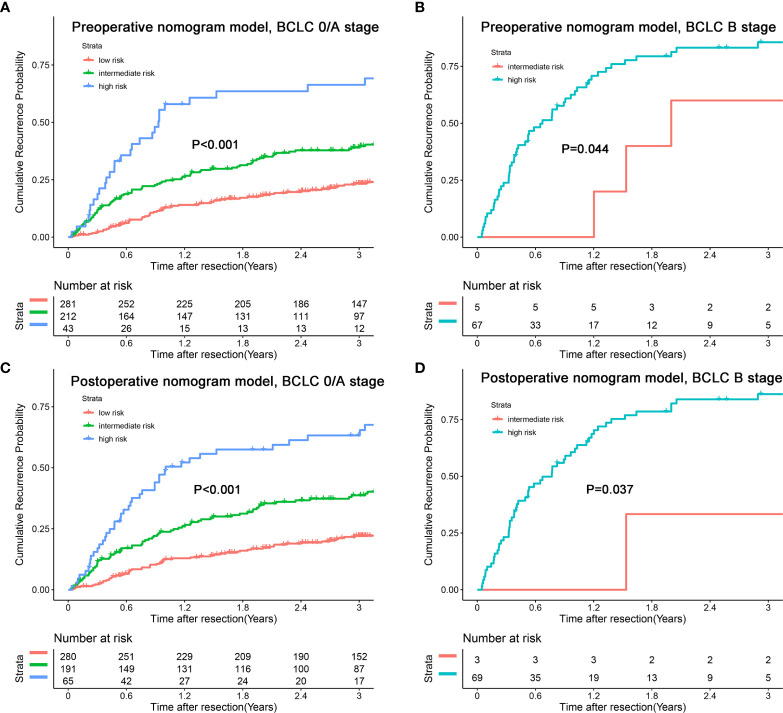
Figure 6.
Kaplan-Meier plots for cumulative recurrence rate of risk subgroups defined by the nomograms model scores in different BCLC stage. (A) preoperative nomogram model, BCLC 0/A stage; (B) preoperative nomogram model, BCLC B stage; (C) postoperative nomogram model, BCLC 0/A stage; (D) postoperative nomogram model, BCLC B stage.

