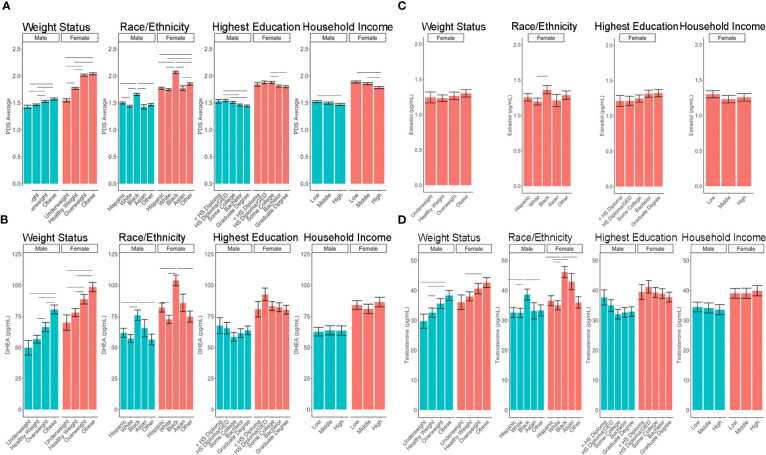
Figure 4.
Post-hoc comparisons of sex differences in the associations between sociodemographic measures and pubertal outcomes of (A) PDS Average, (B) DHEA, (C) Estradiol, (D) Testosterone. Means and standard error (SE) for the fixed effects of weight status, race/ethnicity, highest parental education, and household income by sex, while adjusting for means of all other variables in the model. Lines denote p <0.05 using Tukey multiple comparison correction. HS, High school; GED, General Education Development. Income binned into a numerically coded factor representing low (<$50k), middle ($50–$100k), and high (≥$100k) income.

