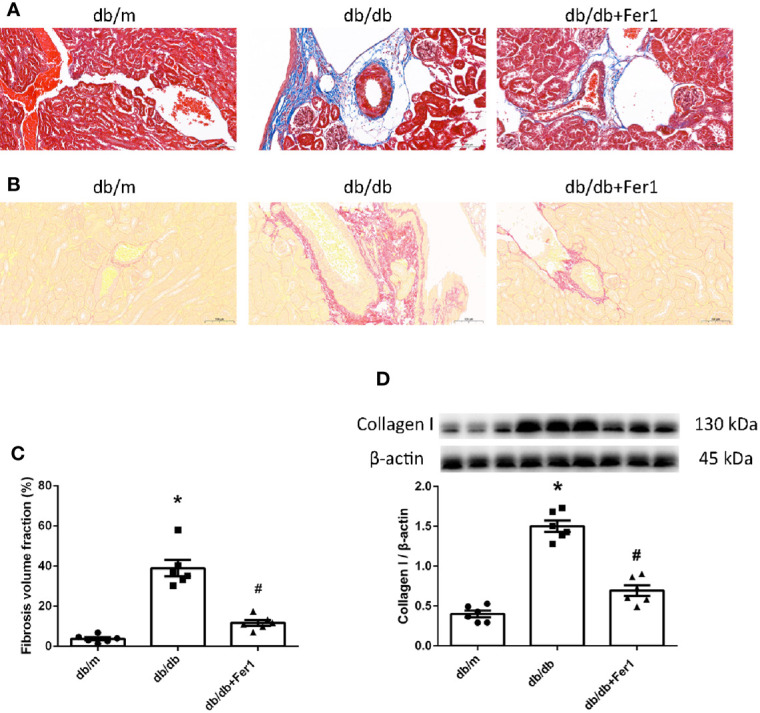
Figure 3.

Renal fibrosis in db/m, db/db, and db/db+Fer1 groups. (A–C). Representative photographs and quantification of renal fibrosis by Masson’s staining (blue) (A) and Sirius red staining (red) (B) (six sections per mouse were analyzed). (D). Representative photographs and quantification of collagen I in mouse kidneys measured by western blot. Male mice, n = 6/group. *P < 0.05, vs db/m group; # P < 0.05, vs db/db group. Db/m, db/m mice; db/db, db/db mice without Ferrostatin-1 treatment; db/db+Fer1, db/db mice with Ferrostatin-1 treatment. Data are means ± S.E.M.
