
Figure 4.
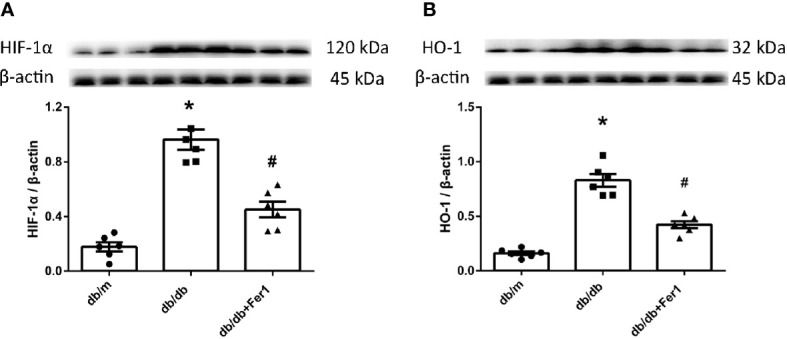
The expression of hypoxia-inducible factor (HIF) -1α and heme oxygenase (HO) -1 in mouse renal tissues. (A, B). Representative photographs and quantification of HIF-1α (A) and HO -1 (B) in mouse kidneys measured by western blot. Male mice, n = 6/group. *P < 0.05, vs db/m group; # P < 0.05, vs db/db group. Db/m, db/m mice; db/db, db/db mice without Ferrostatin-1 treatment; db/db+Fer1, db/db mice with Ferrostatin-1 treatment. Data are means ± S.E.M.