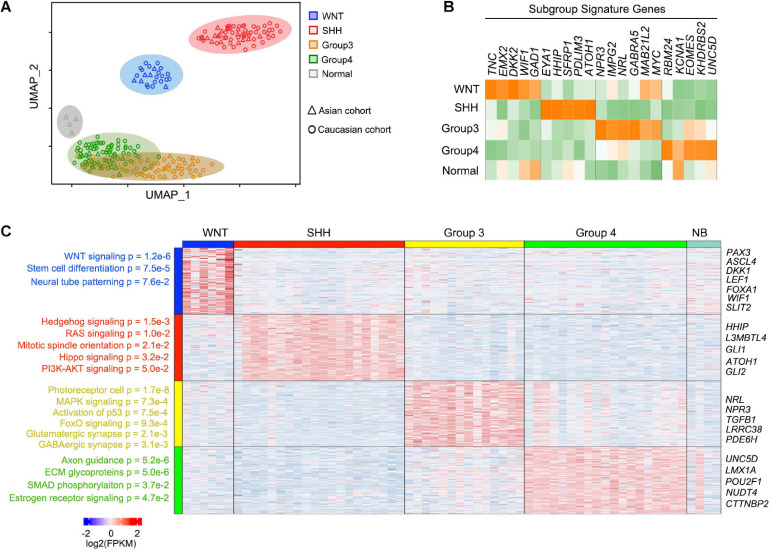
FIGURE 2.
Signature genes for each MB subgroup and function enrichment. (A) UMAP plots for the 59 newly reported MBs and four normal cerebellar samples with similarity measured by the expression level of highly variable genes. The Caucasian MB cohort was used as the control of the known subgroup MB. (B) Heatmap of known marker genes for four subgroups of newly reported MBs showing significant differential expression across subgroups. (C) Heatmap and enriched pathway for the differential feature genes across MBs.

