
Fig. 2.
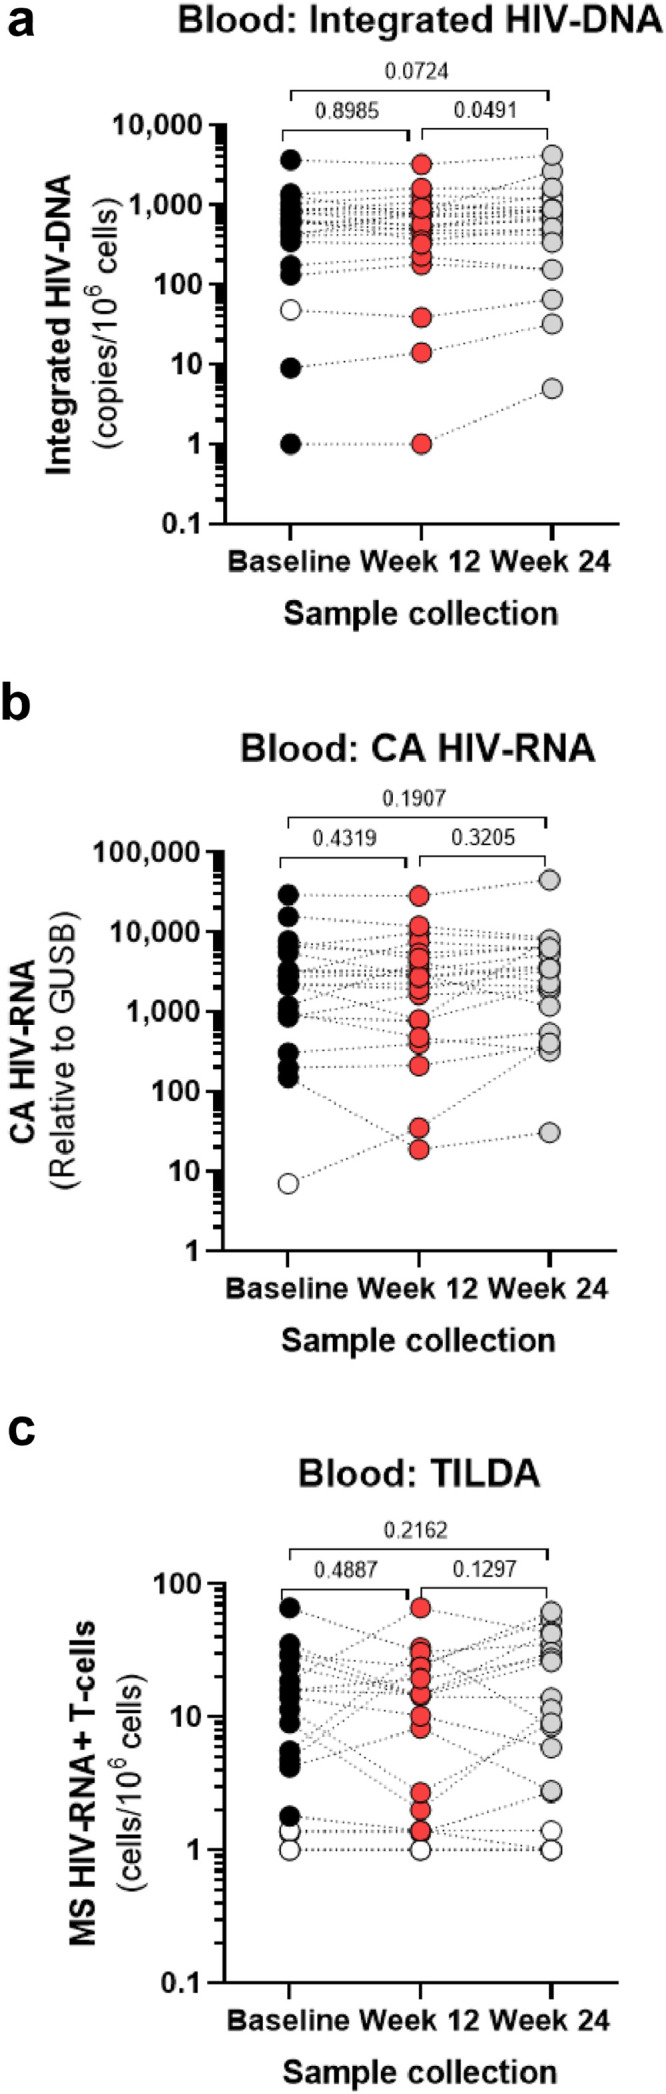
Effects of metformin treatment on viral reservoirs in peripheral blood CD4+ T-cells. Total CD4+ T-cells were enriched from fresh PBMCs isolated at Baseline (back circles), Week 12 (red circles) and Week 24 (grey circles) from the blood of study participants (n=22, Supplemental Table 1) by negative selection. (a) Levels of integrated HIV-DNA (Alu/HIV-LTR primers) were quantified by real-time nested PCR in cell lysates; shown are HIV-DNA copy numbers per 106 cells (two CD3-DNA copies/cell). (b) Total RNA was extracted from total CD4+ T-cells and CA HIV-RNA (LTR/Gag primers) levels were quantified by real-time RT-PCR. Shown are CA HIV-RNA copy numbers relative to GUSB mRNA (housekeeping gene). (c) The frequency of inducible MS HIV-RNA in CD4+ T cells was quantified by TILDA; shown are values normalized per 106 cells. (a-c) Grey bars represent mean values of different virological measurements. Values under the limit of detection are represented with open circles. Wilcoxon p-values for matched paired comparisons are depicted on the graphs.