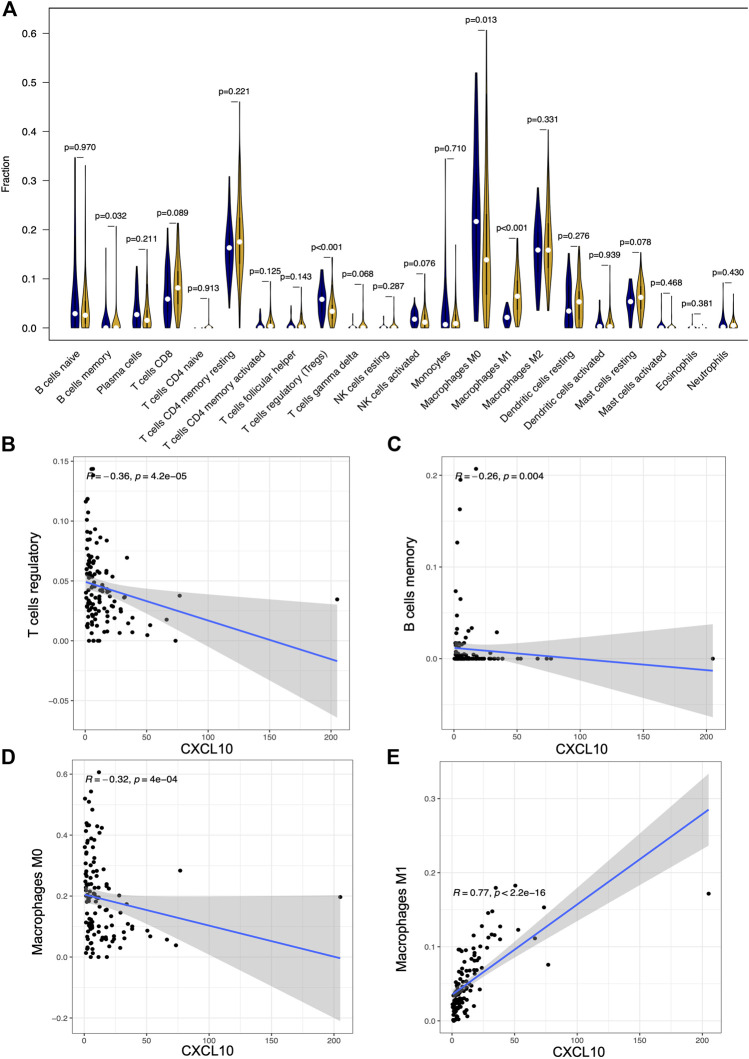
FIGURE 10.
The correlation between the expression of CXCL10 and fractions of tumor infiltrated immune cells. (A) Comparisons of 22 kinds of tumor infiltrated immune cells between high and low CXCL10 expression groups. The blue violin diagram presented low CXCL10 expression group, and the yellow violin diagram presented high CXCL10 expression group. Wilcoxon rank-sum was used for the significance test. (B–E) The correlation between tumor infiltrated immune cells and the expression of CXCL10. Pearson coefficient test was used for the significance test.

