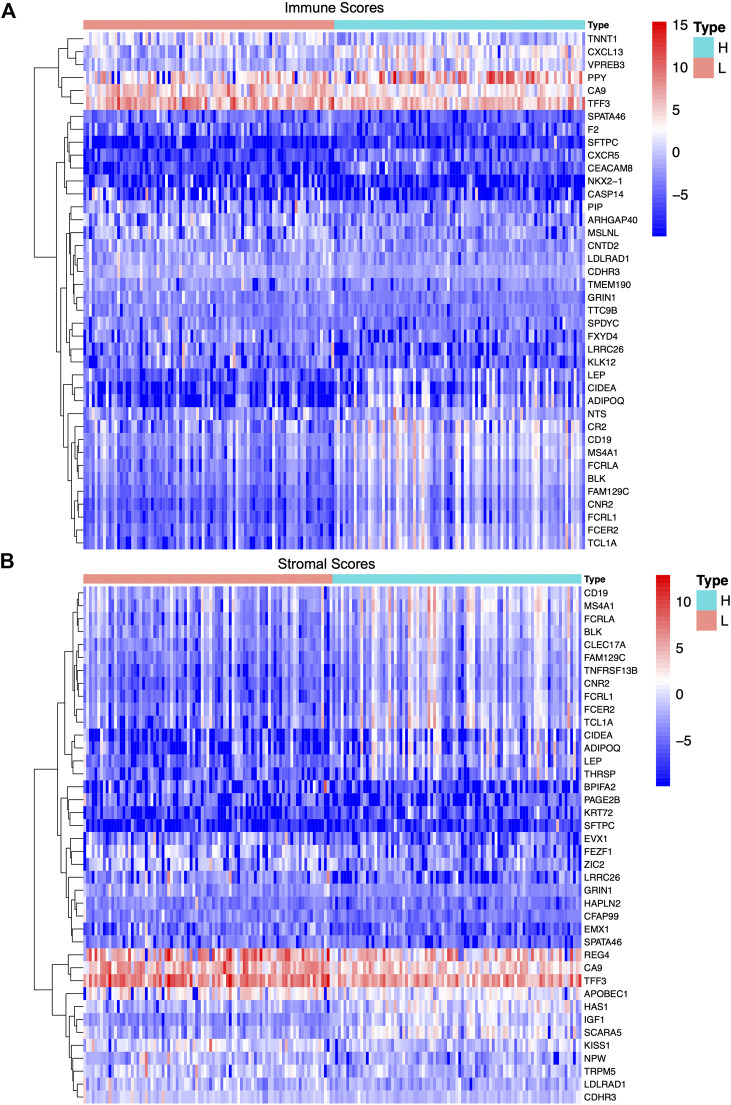
FIGURE 3.
Differentially expressed genes in immune scores and stromal scores of PAAD samples. (A,B) Heat-maps of top 20 differentially expressed genes between high score group and low score group based on immune score and stromal score with the threshold value of p < 0.05 and |log fold change|>1 by Wilcoxon rank-sum test, respectively.

