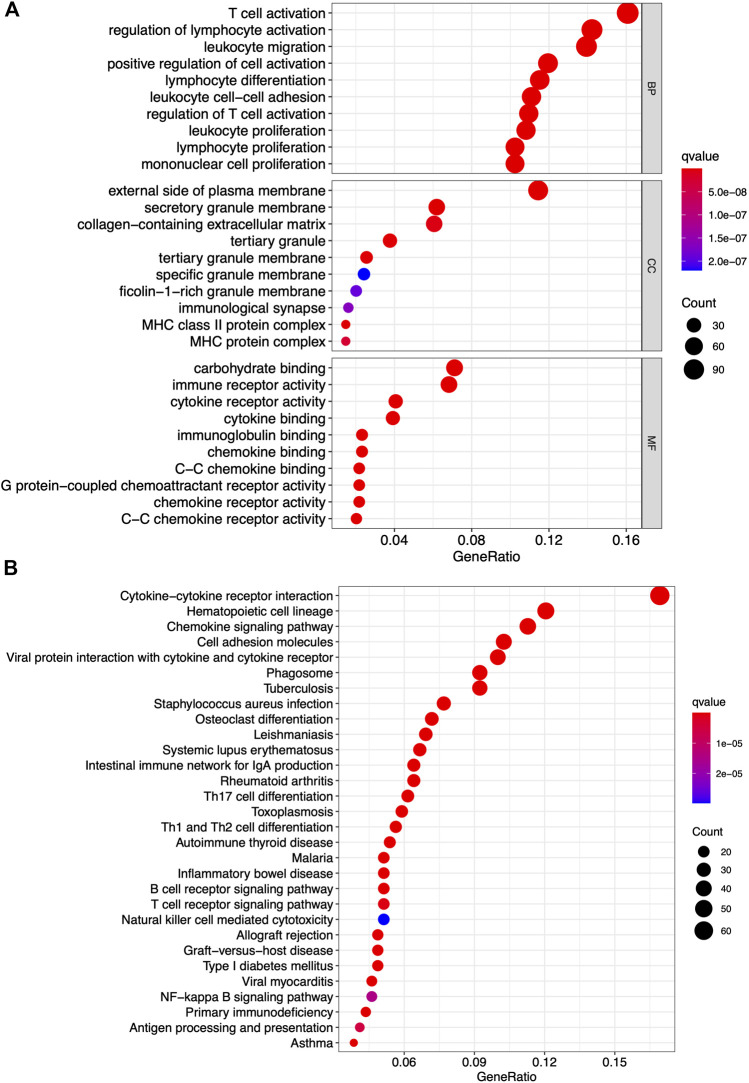
FIGURE 4.
GO and KEGG pathway analyses of differentially expressed gene. (A) Top 10 GO terms in cellular component, molecular function, and biological processes. (B) KEGG pathway enrichment analysis of indicated biological processes. Only both p value and q value less than 0.05 were considered significant.

