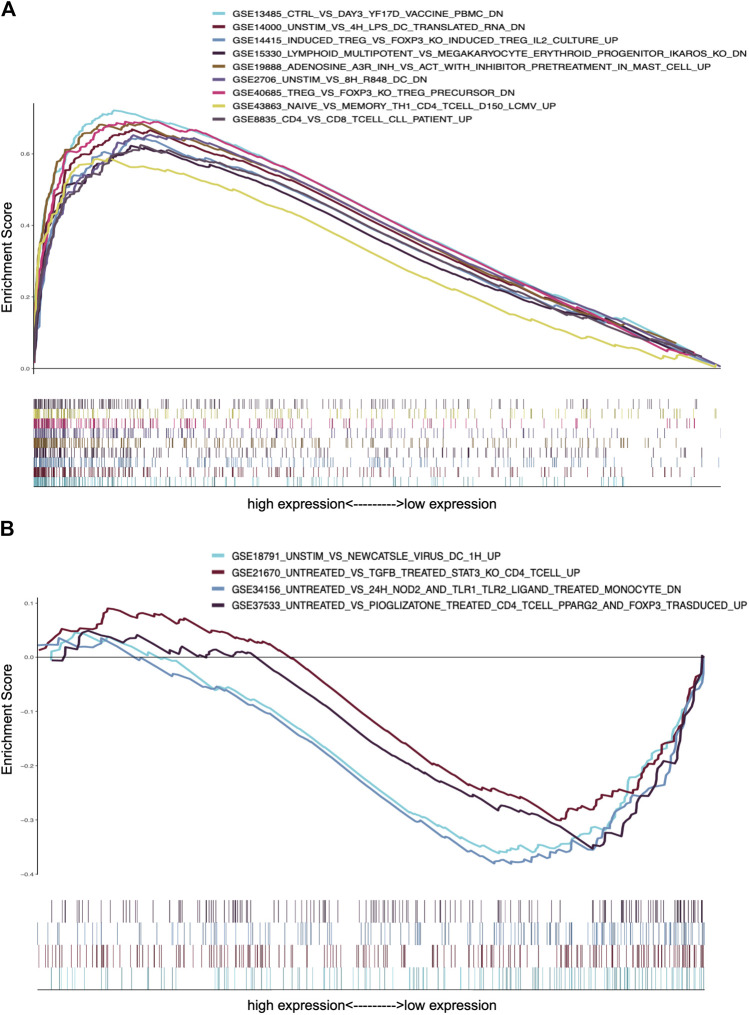
FIGURE 8.
GSEA analysis of CXCL10 expression in PAAD. (A) The enriched gene sets in C7 collection by the high CXCL10 expression cases. (B) The enriched gene sets in C7 collection by the low CXCL10 expression cases. Each color represented corresponding gene set. Genes on the right of X-axis had positive correlation with gene sets, while genes on the left of X-axis had negative correlation with gene sets. Only gene sets with NOM p value < 0.05 were considered as statistically significant.

