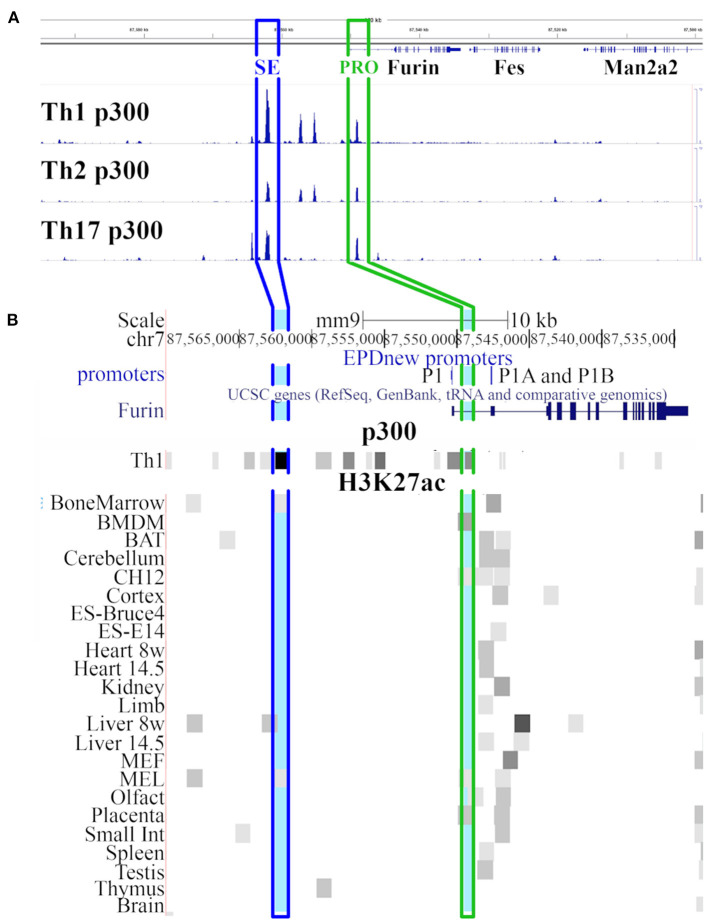
Figure 1.
Genomic view of Furin region. (A) UCSC genome browser (41) view of region chr7: 87,500,000-87,600,000 in mouse genome (mm9 assembly) with p300 Chip-Seq data tracks from the GEO database [GSM994508 (Th1 p300), GSM994516 (Th2 p300), GSM1480824 (Th17 p300) datasets]. The heights of the p300 peaks on the Th1 p300, Th2 p300 and Th17 p300 tracks are relative to the amount of p300 bound to the chromatin. (B) Closer look on Furin gene region (modified UCSC view of region chr7: 87,533,000-87,570,000). The view shows tracks for promoters (EPD viewer hub), Furin gene (Refseq), p300 abundance in Th1 cells (GEO dataset GSM994508), and H3K27ac marks (ENCODE LICR data) in various tissues and cell types. Light blue marks show the genomic region with the most abundant p300 binding 20kb upstream the Furin transcription starting site (SE in blue frame) and within the promoter region (PRO in green frame). SE: putative super-enhancer site, PRO: Furin promoter site.

