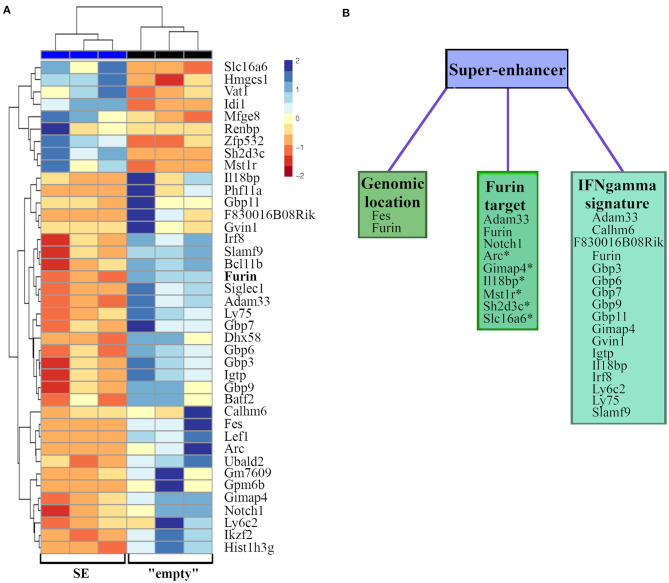
Figure 4.
FURIN SE regulated RNA expressions in activated EL-4 T cells clones. “Empty” and SE EL-4 T cell clones were stimulated for 6 h with PMA and ionomycin (n = 3/genotype). Gene expression of clones was analyzed using RNA sequencing. (A) Heatmap representation of significantly differentially expressed genes (p adj < 0.05). Genes are arranged according to the expression pattern similarity, colors representing the log2-transformed internally normalized RNA read counts. (B) Differentially expressed genes are categorized into groups based on common features, such as close genomic location, validated or predicted (*) FURIN cleavage, or tie to IFNγ.

