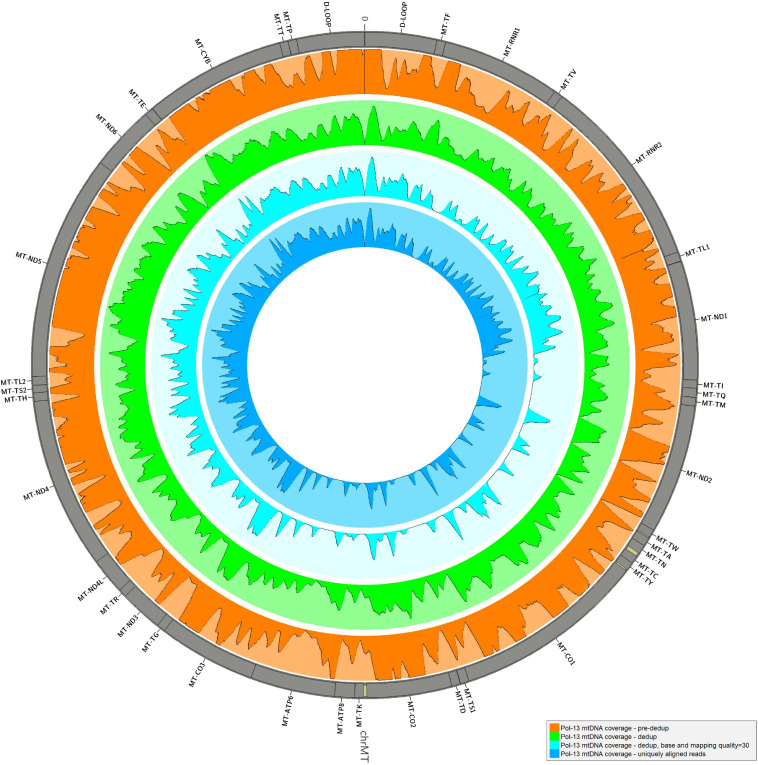
FIGURE 3.
Mean depth of coverage in Pol-13 sample. The mean per base depth of coverage was calculated for Pol-13 alignment at different steps of the pipeline: before and after duplicate removal, filtering by base and mapping quality (≥30), removing all reads ambiguously mapped. Minimum depth in each histogram = 0, maximum depth = 2,000. The graph was generated by Circos (RRID:SCR_011798, v0.69-8) (Krzywinski et al., 2009).

