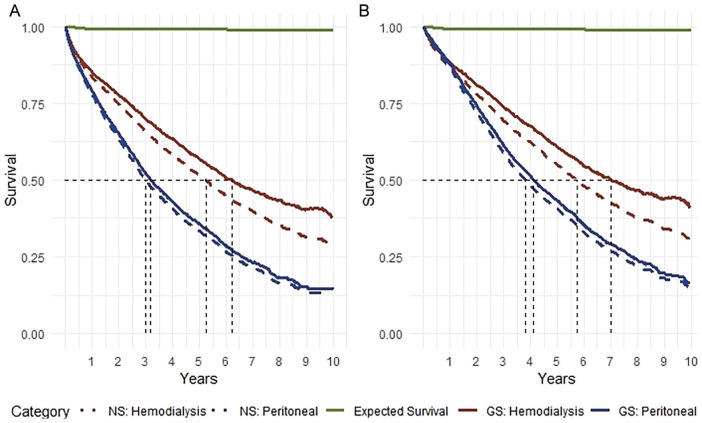
Figure 2.
Survival curves by therapy modality.
Note. Comparison of observed, expected, and net survival times. (A) Analysis in patients according to the treatment assigned at the time of the inception of the cohort. (B) Analysis in patients who never changed the initial modality. The results of both approaches were consistent in showing differences in both mortality rates and net survival between peritoneal dialysis and hemodialysis. NS = net survival; GS = global survival.

