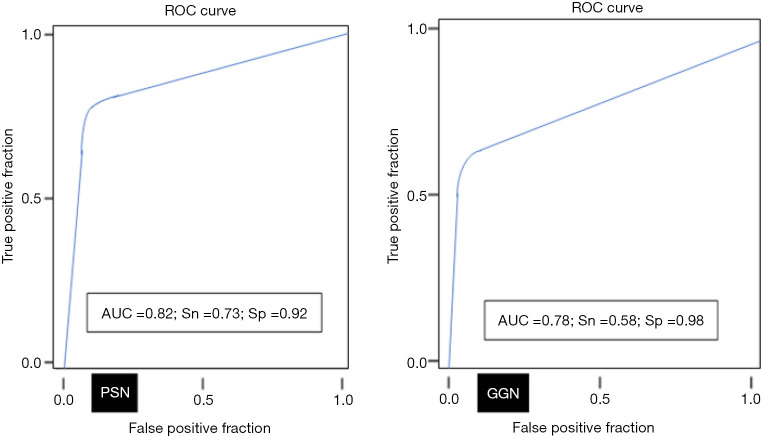
Figure 5.
The line graphs depict AUC (area under the curve for the ROC analyses) for detection of dominant GGN and PSN on AI-AD images. Sn, sensitivity; Sp, specificity; AUC, area under the curve; ROC, receiver operator characteristics; GGN, ground glass nodule; PSN, part-solid nodule; AI-AD, artificial Intelligence-based automatic detection.

