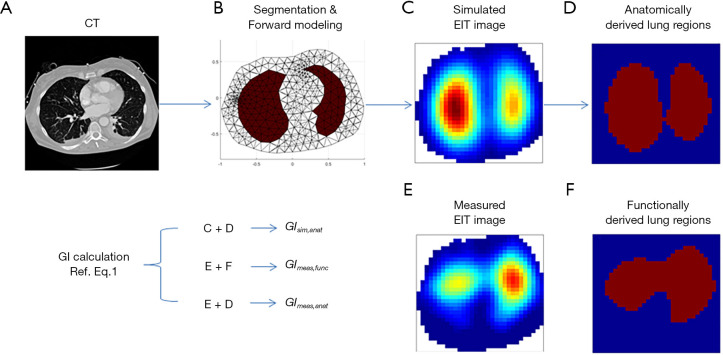
Figure 2.
Illustration of GI calculations. (A) CT image from an individual patient; (B) segmentation of the thorax and lungs, and the corresponding forward model; (C) reconstructed image of an ideal homogeneous ventilation distribution of simulated data (B); (D) the corresponding identified lung regions based on (C); (E) reconstructed image of measured ventilation distribution. F, the corresponding functionally identified lung regions based on E. The GI calculations are according to Eq. 1 in the text. GIsim,anat is based on the simulated image (C) and the lung regions D; GImeas,func is based on measured image (E) and the lung regions (F); GImeas,anat is based on measured image (E) and the lung regions (D).

