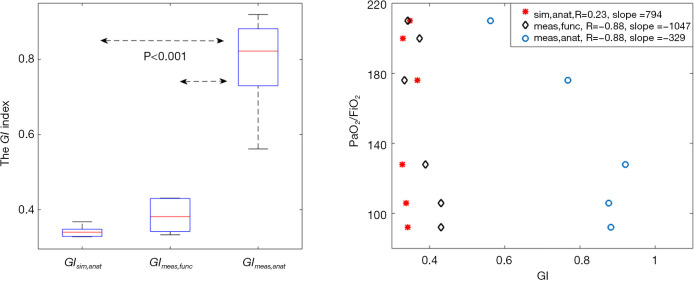
Figure 4.
(A) Comparison of GI values calculated with three different approaches (GIsim,anat, GI calculated from simulated homogeneous distribution with anatomically derived lung regions. GImeas,func, GI calculated from measured data with functional derived lung regions. GImeas,anat, GI calculated from measured data with anatomically derived lung regions.). On each box, the central mark is the median, the edges of the box are the 25th and 75th percentiles, the whiskers extend to the most extreme data points that are not considered as outliers. (B) Correlation between various GI and PaO2/FiO2, arterial oxygen partial pressure to fractional inspired oxygen ratio.

