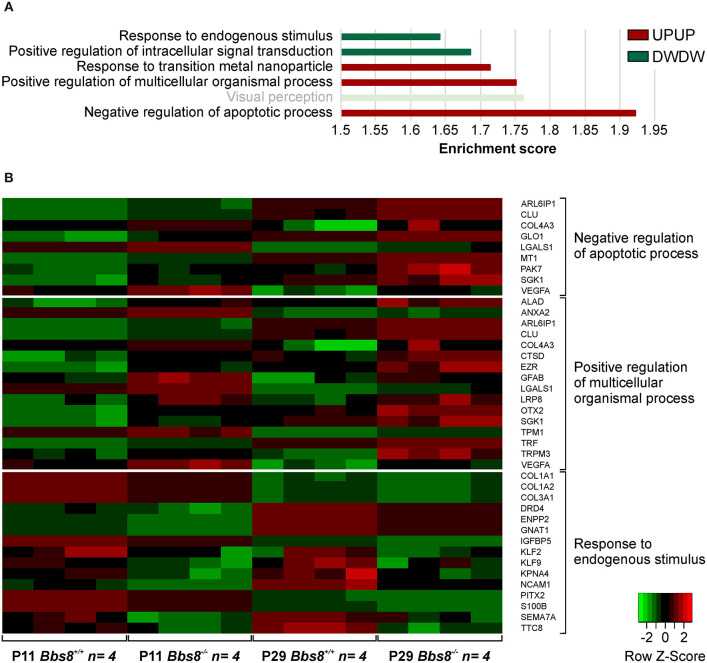
Figure 4.
GOEA of commonly regulated DEGs from Bbs8−/− RPE at P11 and P29. (A) We identified three clusters of Biological processes (BP) that were significantly up-regulated and three that were significantly down-regulated at both time points. Terms are ranked according to the Enrichment score of each BP cluster. Light bright green bar denotes photoreceptor-specific genes. DW, down-regulated; UP, up-regulated. (B) Heatmap of differentially regulated genes associated with processes in A.

