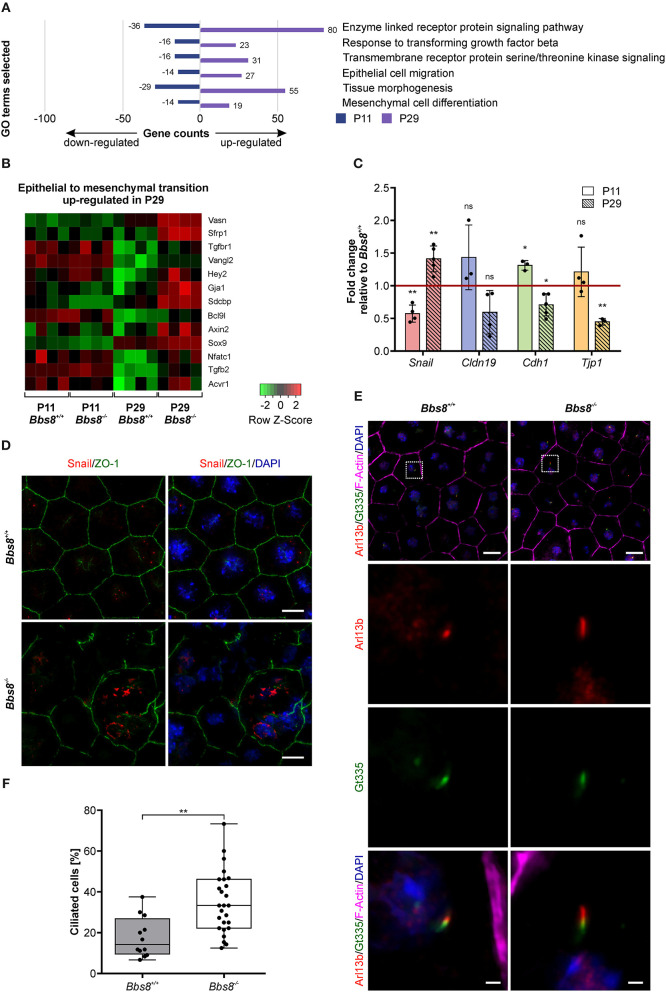
Figure 8.
Loss of Bbs8 induces EMT- like traits in the RPE. (A) GO terms associated with differentially expressed genes that were initially down-regulated at P11 and then up-regulated at P29. (B) Heatmap showing DEGs associated with epithelial-to-mesenchymal transition in the four experimental groups. shi (C) Quantitative gene expression shows a shift toward EMT-like associated gene expression profiles between P11 and P29. Snail expression shifts from down-regulation at P11 (p = 0.0073) toward up-regulation at P29 (p = 0.0096). Expression of Cldn19, Cdh1, and Tjp1 shifts from an up-regulation (Cldn19: p = 0.2681, Cdh1: p = 0.0180 and Tjp1: p = 0.3439) at P11 toward a down-regulation at P29 (Cldn19: p = 0.0919, Cdh1: p = 0.0189 and Tjp1: p = 0.0028) (P11 n: Bbs8−/− = 3–4, Bbs8+/+ = 4; P29 n: Bbs8−/− = 3–5, Bbs8+/+ = 3–5). Statistical analysis was performed using one sample t-test. Cdh1: E-cadherin, Cldn19: Claudin 19, Snail: Snail, Tjp1: tight-junction protein 1. (D) Representative images of P11 RPE flatmounts stained for Snail (red) and ZO-1 (green). DAPI was used to stain nuclear DNA. P11 Bbs8−/− RPE shows an increase in Snail expression especially in cells with disrupted morphology. Scale bars: 10 μm. (E) Representative images of RPE flatmounts at P29, stained for primary cilia using Arl13b (red) and Gt335 (green). F-Actin (magenta) was stained to visualize the cytoskeleton and DAPI was used to stain nuclear DNA. Higher magnifications are indicated in the image by a square. Scale bars: 10 μm, higher magnifications 1 μm. (F) Quantification of ciliated cells in P29 Bbs8 RPE showing a significant increase in ciliation in Bbs8-deficient RPE compared to control (p = 0.0011) (n: Bbs8−/− = 4 eyes, 340 cells, Bbs8+/+ = 2 eyes, 157 cells). Statistical analysis was performed using unpaired t-test. Significance levels: > 0.05 not significant (ns), ≤ 0.05*, ≤ 0.01**, ≤ 0.001***.

