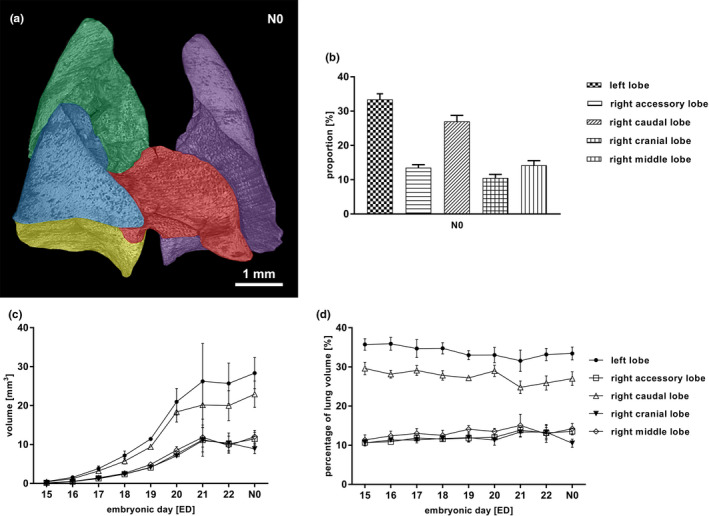
Figure 4.

Segmentation of the lung (a‐d). Rat lung lobe segmentation at N0, left lobe (purple), right cranial lobe (green), right middle lobe (blue), right accessory lobe (red), right caudal lobe (yellow) (a). Proportion of single lobes as percentage of the total lung volume at N0 (b). Volumes of single lung lobes accordantly increased from ED15 to N0 (c), whilst their contribution to the total lung volume remained stable over time (d). All values in mean ± SD
