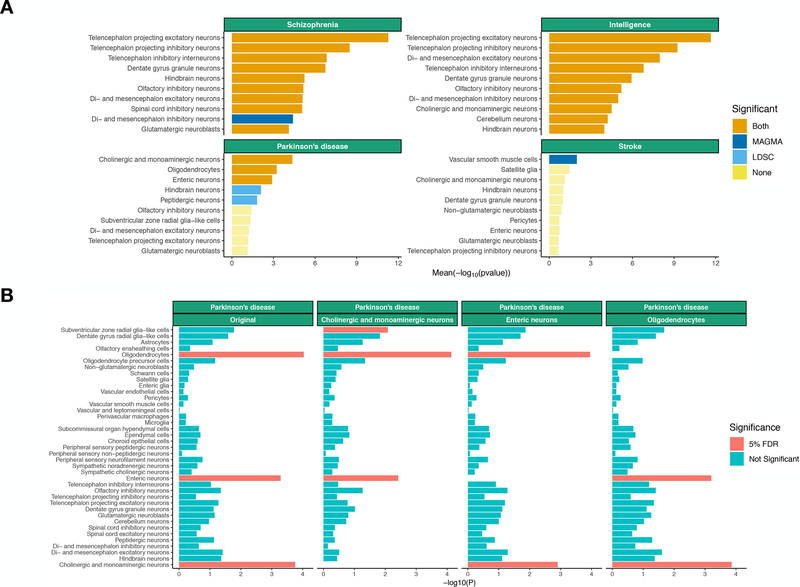
Figure 2:
Association of selected brain related traits with cell types from the entire nervous system. 841 Associations of the top 10 most associated cell types are shown. (A) Conditional analysis results for 842 Parkinson’s disease using MAGMA. The label indicates the cell type the association analysis is being 843 conditioned on. (B) The mean strength of association (−log10P) of MAGMA and LDSC is shown and 844 the bar color indicates whether the cell type is significantly associated with both methods, one method 845 or none (significance threshold: 5% false discovery rate).

