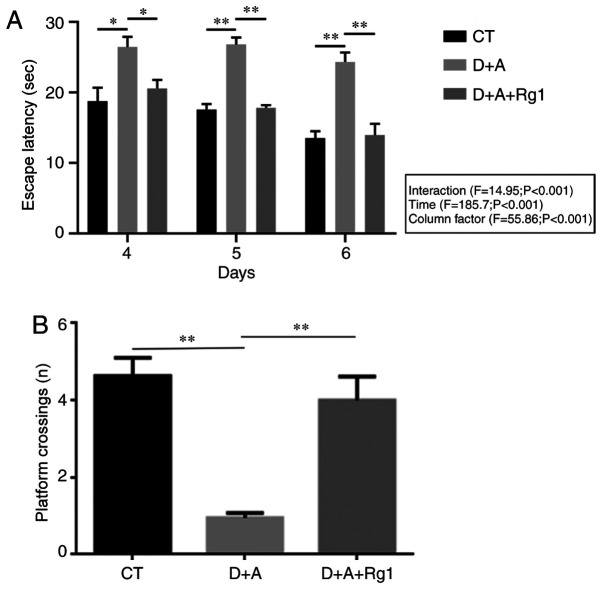
Figure 1.
Statistical results of the Morris water maze. (A) The escape latency of AD tree shrews on days 4–6 in the three groups. (B) The number of times tree shrews crossed the platform on day 7 in the three groups. *P<0.05, **P<0.01. AD, Alzheimer's disease; CT, control group; D+A, model group; D+A+Rg1, treatment group; Rg1, ginsenoside Rg1.

