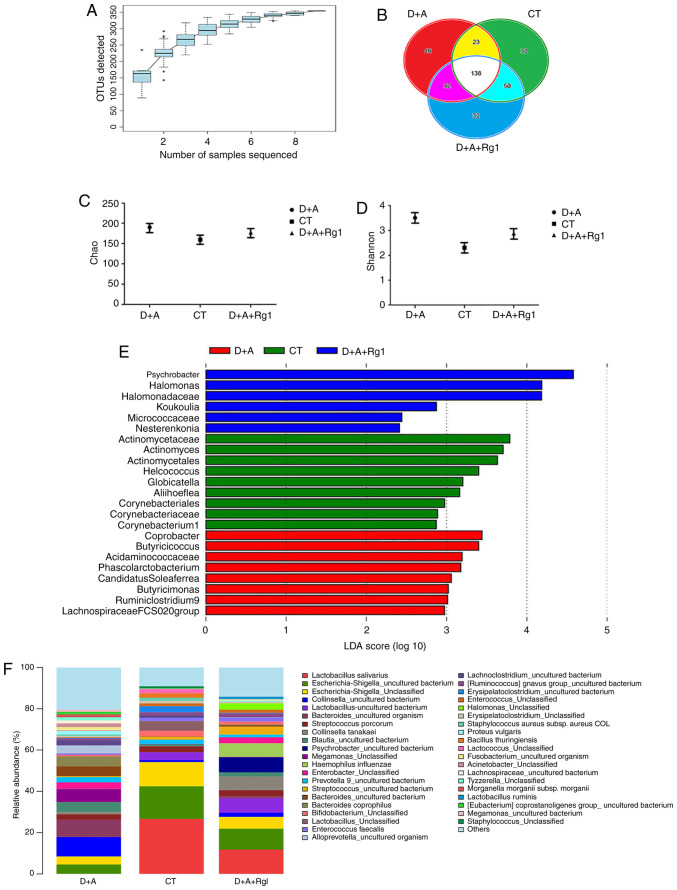
Figure 5.
Analysis of intestinal bacteria. (A) Species accumulation curves. (B) OTUs sharing relationship. Index analysis of (C) Chao and (D) Shannon. (E) LDA score of linear discriminant analysis effect size analysis of tree shrew intestinal flora in the three groups. (F) The analysis of intestinal flora in the genus level. OTUs, operational taxonomic unit; D+A, model group; CT, control group; D+A+Rg1, treatment group; Rg1, ginsenoside Rg1; LDA, linear discriminant analysis.

