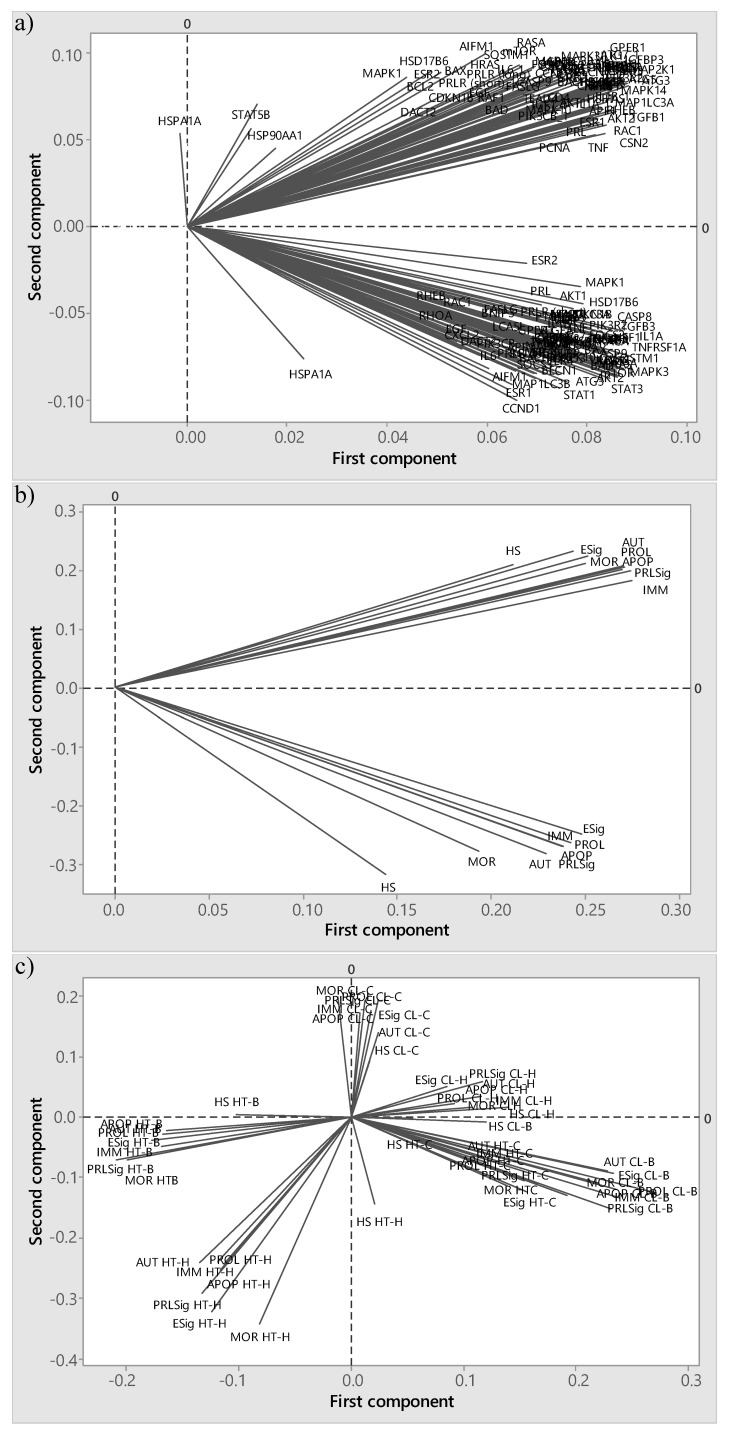
Figure 3.
Loading plots describing relationships between: (a) mammary gland relative expression of 91 genes (as detailed in Table S1) and biopsy collection time point, (b) gene functions: heat shock (HS), prolactin signalling (PRLSig), oestrogen signalling (ESig), cell proliferation (PROL), autophagy (AUT), apoptosis (APOP), morphology (MOR), and immunity (IMM), and (c) in vivo and in vitro treatments from a principal component analysis. Figure 3c included genes averaged heat shock (HS), prolactin signalling (PRLSig), oestrogen signalling (ESig), cell proliferation (PROL), autophagy (AUT), apoptosis (APOP), morphology (MOR), and immunity (IMM), by in vivo and in vitro treatments CL-H, CL-C, CL-B, HT-H, HT-C, and HT-B.

