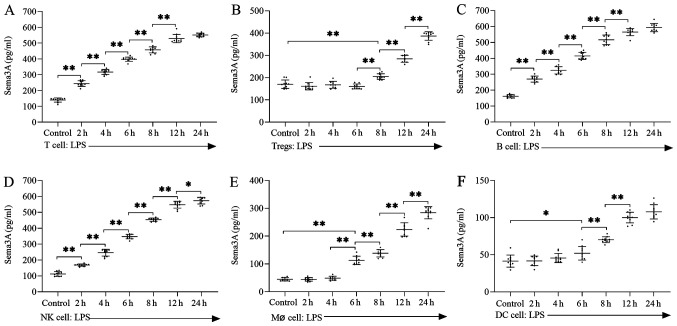
Figure 2.
LPS increases the concentration of Sema3A in both lymphoid and myeloid lineages. Secretion levels of Sema3A from (A) T cells, (B) Tregs, (C) B cells, (D) NK cells, (E) Mø cells and (F) DC. Data are presented as the mean ± standard deviation, n=10 per group. One-way ANOVA was performed for data analysis. *P<0.05, **P<0.01. LPS, lipopolysaccharide; Tregs, regulatory T cells; Mø, macrophage; DC, dendritic cells; NK, natural killer; Sema3A, semaphorin 3A.

