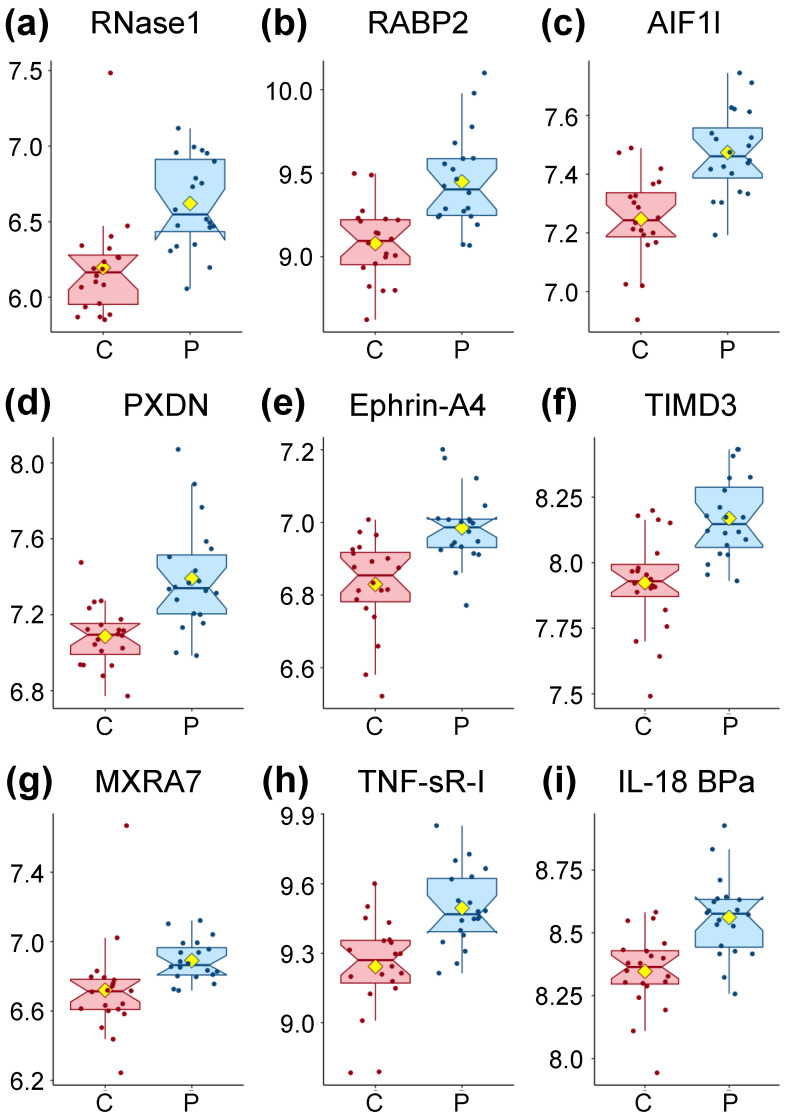
Figure 1.
Box plot distribution of logged values for the proteins significantly different between controls and patients through Wilcoxon rank-sum testing with p < 0.05 and q < 0.05 displayed in Table 2. Controls (C) are shown in red and Myalgic Encephalomyelitis/Chronic Fatigue Syndrome (ME/CFS) patients (P) in blue. The yellow diamond represents the mean.

