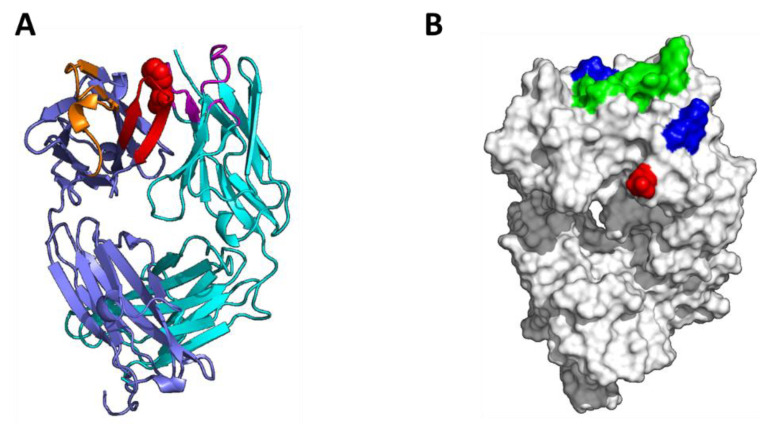
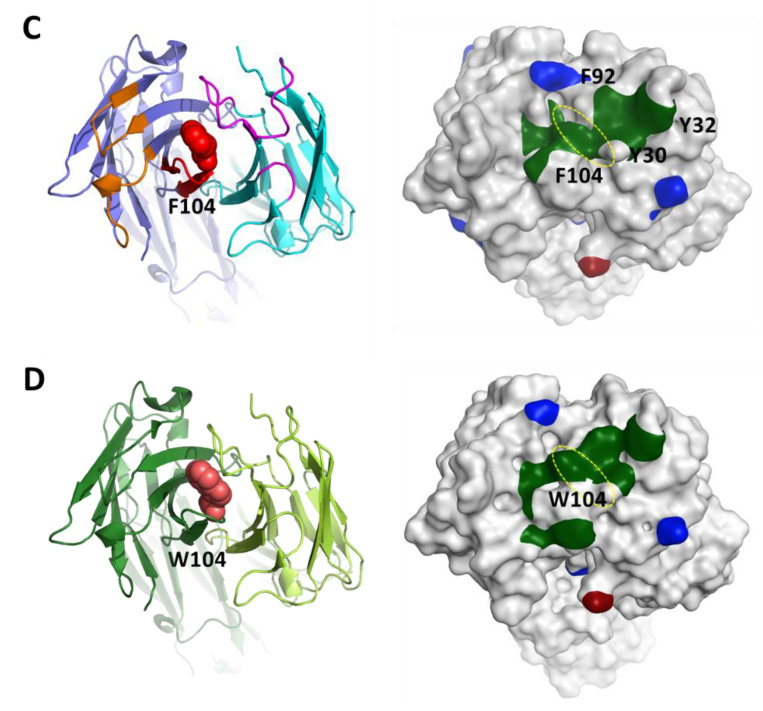
Figure 5.
Fab homology models. (A) Model of HC:F104 Fab with VL in teal, VH in blue, VL CDR1-3 in purple, VH CDRs 1–2 in orange, VH CDR3 in red, and F104 in red spacefill. (B) Surface patch analysis of HC-F104 Fab homology model with hydrophobic patches in green, positive patches in blue, and negative patches in red. (C,D) Top view of CDR region of HC-F104 Fab and HC-W104 Fab homology models, respectively, rendered in Pymol. Left, ribbon depiction with F104 or W104 highlighted in red spacefill. Right, patch analysis rendered in MOE. F104 and W104 are circled with a dashed yellow ellipse.


