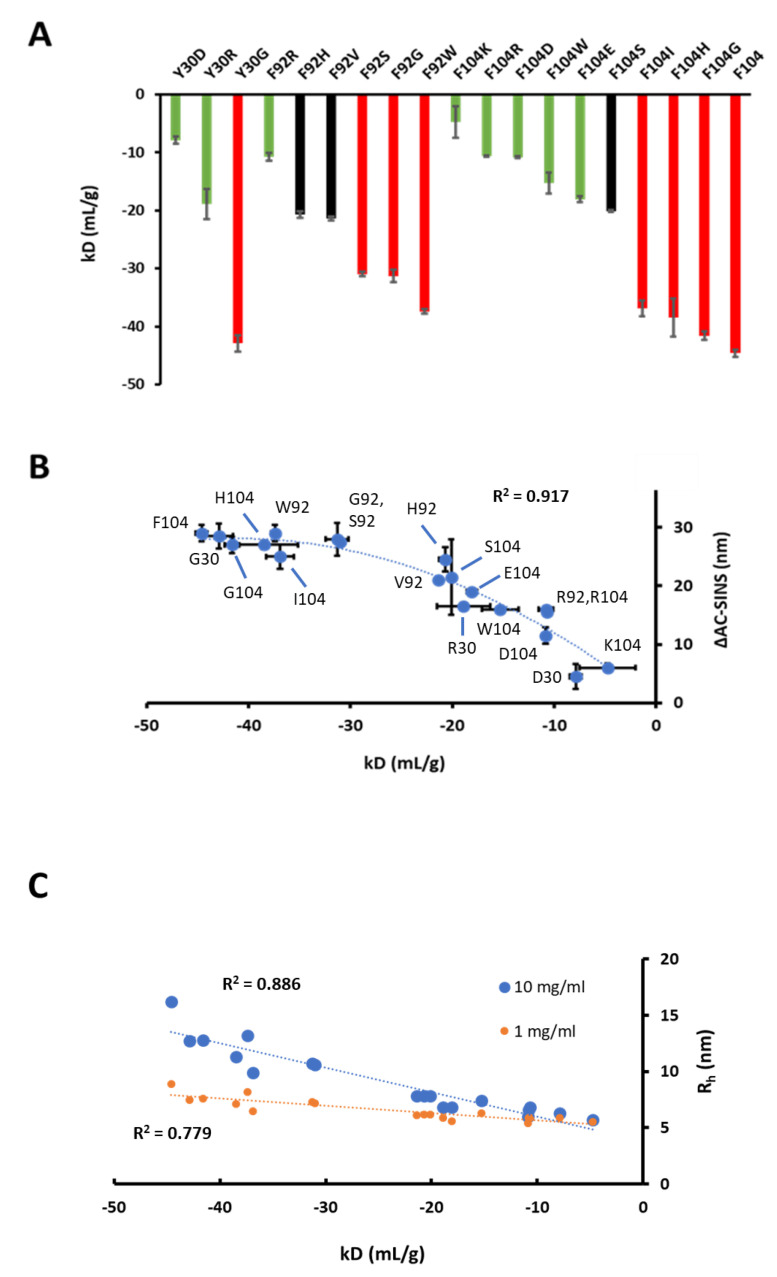
Figure 7.
(A) kD (mL/g) obtained by DLS (1–10 mg/mL in PBS) shown as bar plots for all variants engineered at HC-104, LC-Y30, and LC-F92. Obtained kD values less than −30 mL/g are shaded red bars, and those higher than −20 mL/g are shaded green. Values between −20 and −30 mL/g are shaded black. Error bars are shown. (B) kD values obtained for all 19 interface mutants are plotted against corresponding ∆AC-SINS values (blue circles with error bars for each method and the R2 of the parabolic fit). Each data point is labeled by variant. (C) kD values obtained for all 19 interface mutants are plotted against corresponding Rh values (nm) obtained at both 1 mg/mL (orange circles) and 10 mg/mL (blue circles) along with R2 of the linear fits.

