Fig. 2.

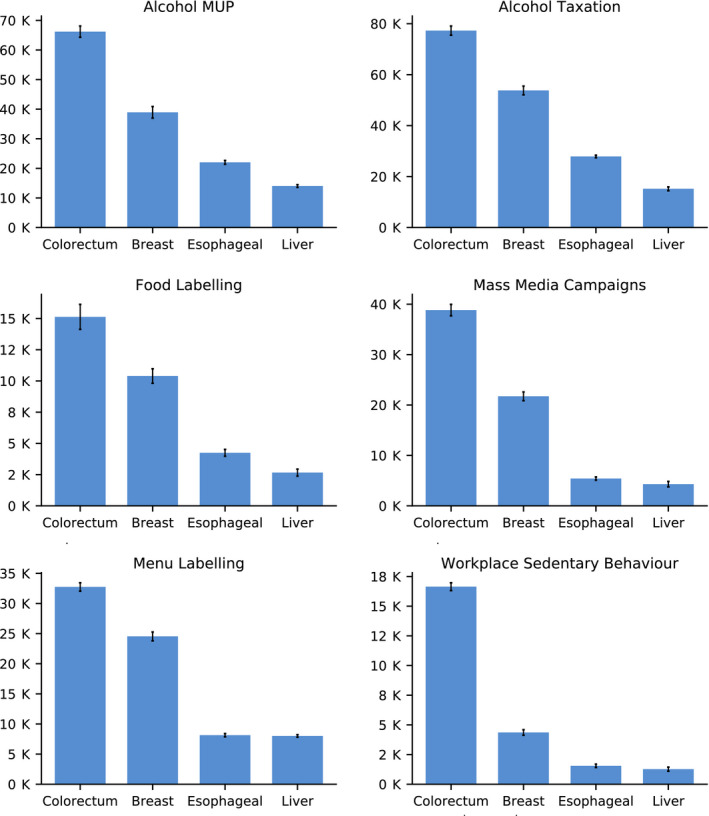
New cancer cases avoided by type of cancer and intervention by 2050. Vertical black lines represent 95% CI. Source: OECD SPHeP‐NCD model, 2020.

New cancer cases avoided by type of cancer and intervention by 2050. Vertical black lines represent 95% CI. Source: OECD SPHeP‐NCD model, 2020.