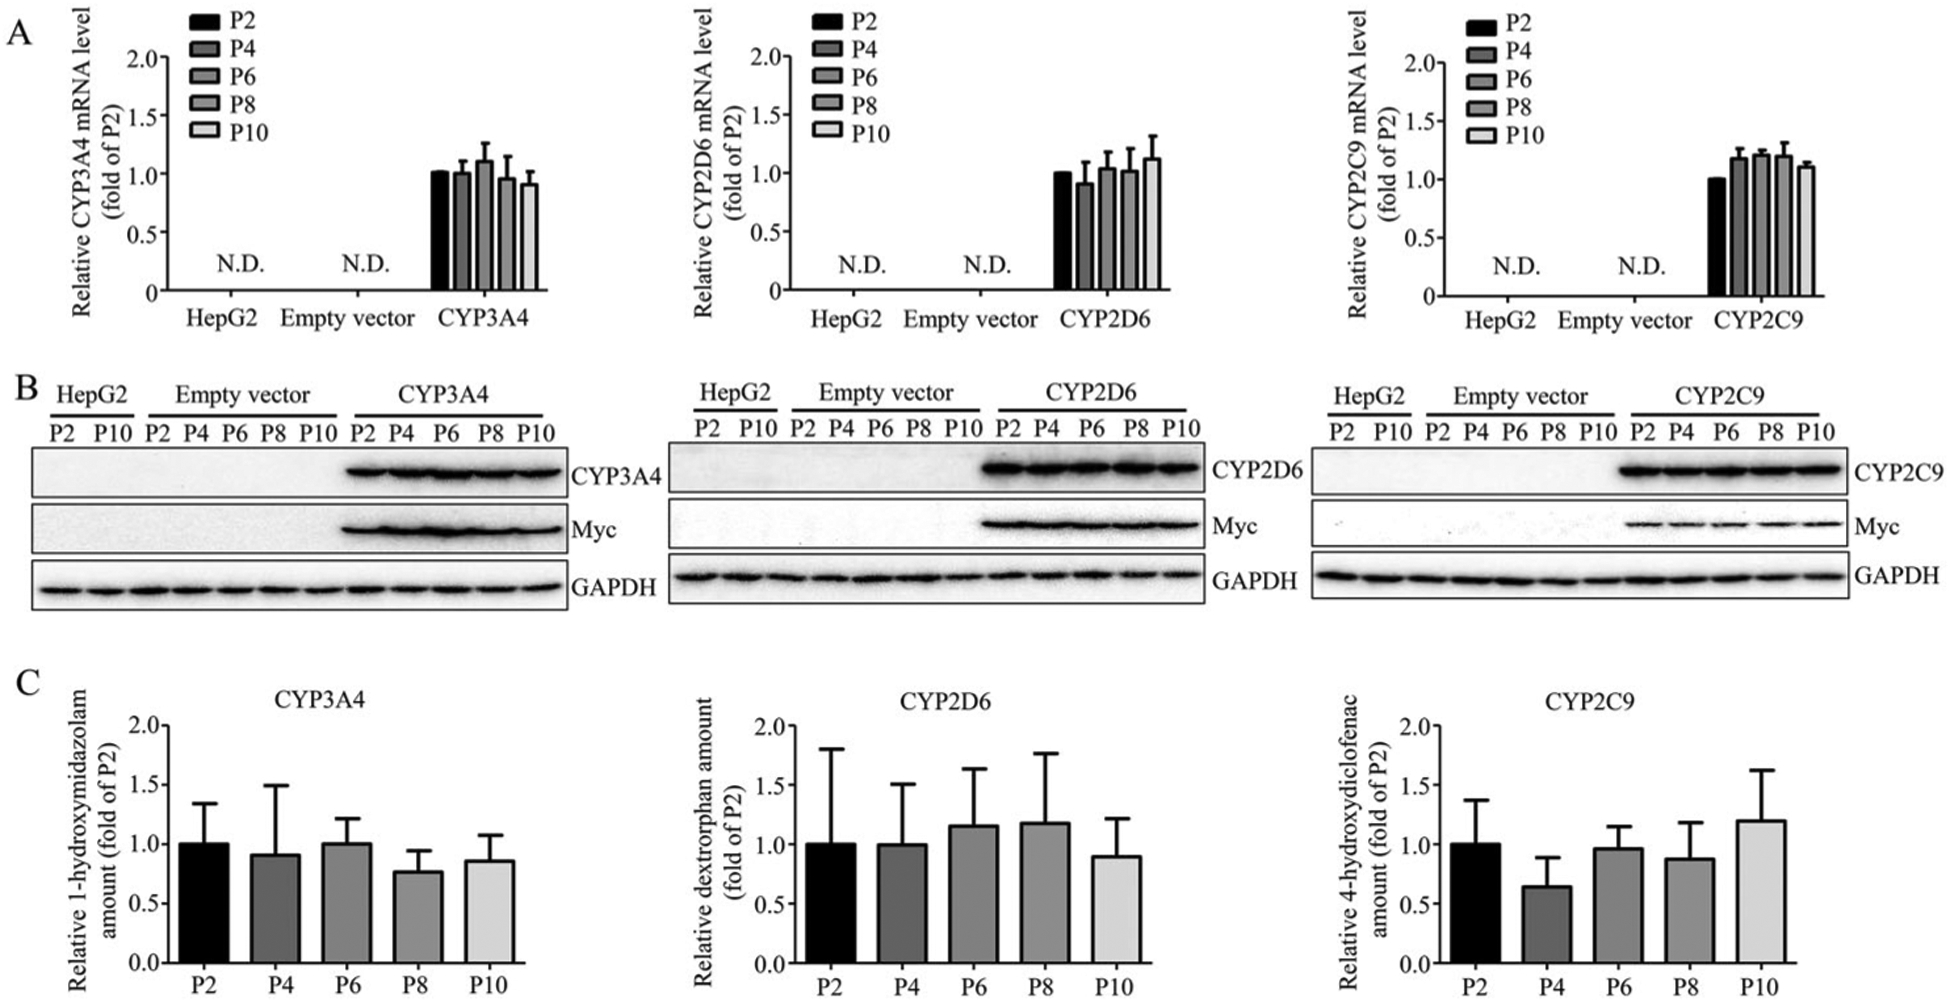
Figure 3.

The stability of overexpressed CYP3A4, 2D6, and 2C9. The overexpression of CYP3A4, 2D6, and 2C9 at mRNA level (A), protein level (B), and enzymatic activity level (C) in HepG2-CYP3A4, HepG2-CYP2D6, HepG2-CYP2C9 cell lines was measured at indicated passage number by real-time PCR, Western blotting, and LC-MS. The results shown are mean ± S.D. from three independent experiments. Statistical analysis was conducted using one-way analysis of variance (ANOVA) followed by the Dunnett’s tests for pairwise-comparisons.
