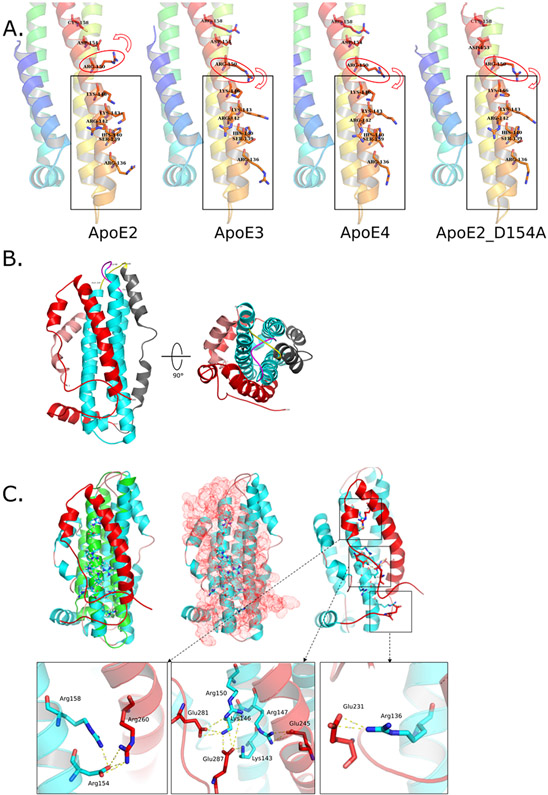
Figure 2. Structural analysis focusing on LDLR binding regions on ApoE.
A) Putative explanation of isoform differences in affecting LDLR binding region from crystal structures. From left to right: ApoE2, ApoE3, ApoE4 and ApoE2_D154A. Red ellipses highlight the key Arg150 only captured by Asp154 in ApoE2 that affects LDLR binding site. Red arrows indicate different orientations of Arg150 in those structures. Grey rectangles show the LDLR binding sites on ApoE structures. PDB files from left to right: 1le2, 1ple, 1le4, 1nfo.
B) NMR structure of full-length ApoE3 (PDB: 2l7b). Salmon: N-terminal residues (1-24); Cyan: N-terminal α-helix bundle (25-163); Yellow: free loop (164-168); Grey: hinge region; Red: C-terminal. Cyan structure shows the α-helix bundle consistent with previous X-ray crystal structures. Yellow loop highlights the “lock” of N-terminal α-helix bundle to unfold. The grey hinge region and red C-terminal domain cover N-terminal α-helix bundle that was assumed solvent exposed.
C) NMR structure of full-length ApoE3 showed that LDLR binding region is completed covered in non-lipidated form. Top-left panel shows the superposition of crystal structure of ApoE3 N-terminal domain (Green, PDB: 1lpe) to NMR structure (Cyan and Red, PDB: 2l7b), key residues involved in LDLR binding are highlighted with hydrogen atoms (white); Top-middle panel shows that LDLR binding site on N-terminal domain of ApoE3 is completely capped by C-terminal (Red dots represent the atomic surface of C-terminal domain); Top-right panel highlights key interactions between acidic residues on C-terminal domain and basic residues in LDLR binding, enlarged views of three interaction cores between N-terminal and C-terminal domains are presented at the bottom. NOTE: Q279 and E287 are mutations generated by the authors.

