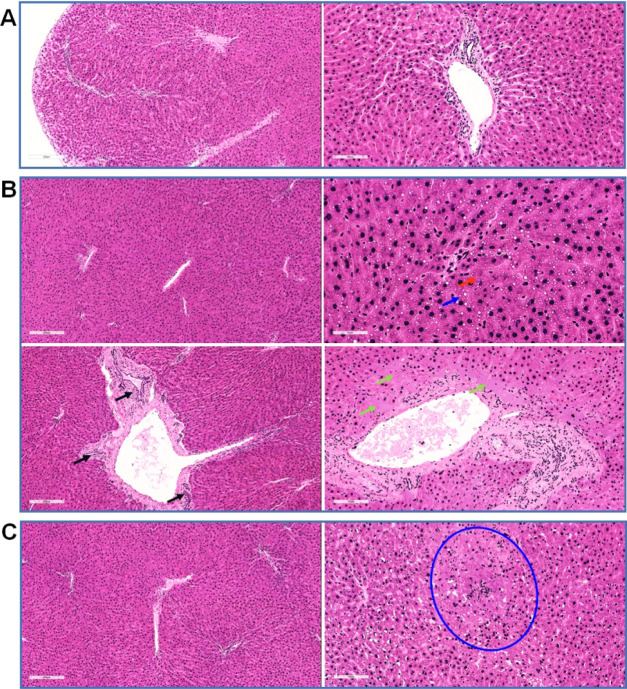
Figure 2.
Representative light photomicrographs of rat liver specimens for hematoxylin and eosin (H&E) analysis (n = 5). (A) Group I: the hepatic lobules were evenly distributed and the structure was clear. (B) Group II: cholestasis in hepatocytes (red arrow, brown granules in cells), mild steatosis (blue arrow, cytoplasmic vacuoles), sheet necrosis of hepatocytes around the portal area (green arrow, no nuclear region), proliferation of small bile ducts in the portal area (black arrow), and congestion of some veins. (C) Group III: the liver lobules were distributed evenly, the structure was clear, the liver cord was arranged in a regular way, and only one focus of liver cell necrosis was observed (shown in the blue circle, in which the cell structure was disordered and nuclear fragments were visible).

