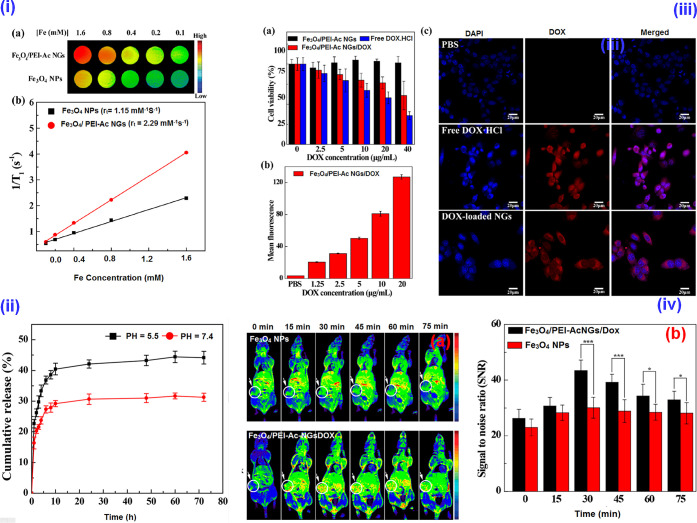
Figure 8.
(i) (a) Color T1-weighted MR images of the ultrasmall Fe3O4 NPs and Fe3O4/PEI-Ac NGs at different Fe concentrations, indicating the gradual increase of MR signal intensity. (b) Linear fitting of 1/T1 as a function of Fe concentration for the two different materials. (ii) The Dox release from the Fe3O4/PEI-Ac NG/Dox under different pH. (iii) (a) The CCK-8 assay of 4T1 cell viability after treatment formulations with different Dox concentrations for 24 h. (b) The mean fluorescence of cells treated with Fe3O4/PEI-Ac NGs/Dox as a function of Dox concentration. (c) Confocal microscopic images of 4T1 cells after treatment for 4 h with various formulations at 10 μg/mL of Dox concentration. (iv) The in vivo T1-weighted MR images (a) and MR signal-to-noise ratio (b) of the xenografted 4T1 tumors before and at different time points post i.v. injection of Fe3O4 NPs or Fe3O4/NGs-Ac NGs/Dox (Fe mass = 150 μg, in 0.2 mL of PBS for each mouse). Reprinted with permission from ref (29). Copyright 2020, American Chemical Society.

